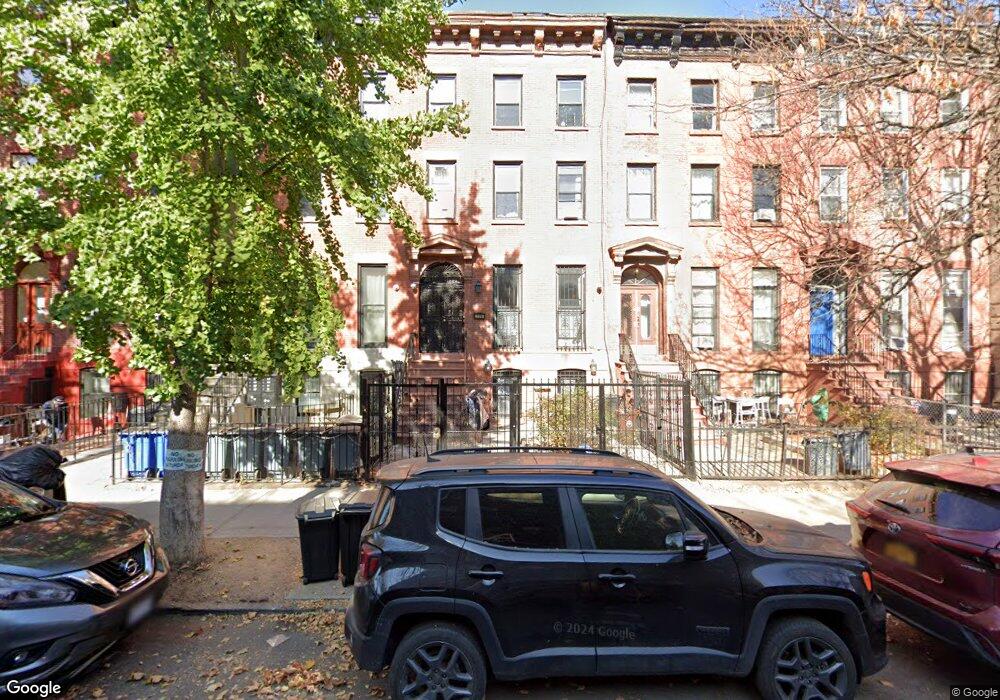
179 Herkimer St Brooklyn, NY 11216
Bed-Stuy NeighborhoodEstimated Value: $1,721,000 - $2,817,000
6
Beds
3
Baths
3,200
Sq Ft
$681/Sq Ft
Est. Value
About This Home
This home is located at 179 Herkimer St, Brooklyn, NY 11216 and is currently estimated at $2,180,695, approximately $681 per square foot. 179 Herkimer St is a home located in Kings County with nearby schools including P.S. 93 - William H. Prescott, Leadership Preparatory Bedford Stuyvesant Charter School, and The Co-op School.
Ownership History
Date
Name
Owned For
Owner Type
Purchase Details
Closed on
Aug 30, 2017
Sold by
Lewis Rene
Bought by
Lsq Common Llc
Current Estimated Value
Home Financials for this Owner
Home Financials are based on the most recent Mortgage that was taken out on this home.
Original Mortgage
$480,000
Outstanding Balance
$401,049
Interest Rate
3.92%
Mortgage Type
Purchase Money Mortgage
Estimated Equity
$1,779,646
Purchase Details
Closed on
Oct 9, 2003
Sold by
Holden Mary R
Bought by
Lewis Rene
Home Financials for this Owner
Home Financials are based on the most recent Mortgage that was taken out on this home.
Original Mortgage
$320,000
Interest Rate
5.98%
Mortgage Type
Purchase Money Mortgage
Purchase Details
Closed on
Oct 30, 1997
Sold by
Landmark Equities Corp
Bought by
Holden Mary R
Home Financials for this Owner
Home Financials are based on the most recent Mortgage that was taken out on this home.
Original Mortgage
$187,100
Interest Rate
7.14%
Mortgage Type
FHA
Purchase Details
Closed on
Sep 22, 1995
Sold by
Chemical Mtg Company
Bought by
Landmark Equities Corp
Create a Home Valuation Report for This Property
The Home Valuation Report is an in-depth analysis detailing your home's value as well as a comparison with similar homes in the area
Home Values in the Area
Average Home Value in this Area
Purchase History
| Date | Buyer | Sale Price | Title Company |
|---|---|---|---|
| Lsq Common Llc | $1,538,000 | -- | |
| Lewis Rene | $400,000 | -- | |
| Holden Mary R | $225,000 | Commonwealth Land Title Ins | |
| Landmark Equities Corp | $85,000 | -- |
Source: Public Records
Mortgage History
| Date | Status | Borrower | Loan Amount |
|---|---|---|---|
| Open | Lsq Common Llc | $480,000 | |
| Previous Owner | Lewis Rene | $320,000 | |
| Previous Owner | Holden Mary R | $187,100 |
Source: Public Records
Tax History Compared to Growth
Tax History
| Year | Tax Paid | Tax Assessment Tax Assessment Total Assessment is a certain percentage of the fair market value that is determined by local assessors to be the total taxable value of land and additions on the property. | Land | Improvement |
|---|---|---|---|---|
| 2025 | $5,563 | $123,780 | $22,320 | $101,460 |
| 2024 | $5,563 | $107,100 | $22,320 | $84,780 |
| 2023 | $5,312 | $115,800 | $22,320 | $93,480 |
| 2022 | $5,013 | $109,080 | $22,320 | $86,760 |
| 2021 | $4,885 | $105,360 | $22,320 | $83,040 |
| 2020 | $12 | $88,080 | $22,320 | $65,760 |
| 2019 | $4,828 | $91,860 | $22,320 | $69,540 |
| 2018 | $4,443 | $21,795 | $4,890 | $16,905 |
| 2017 | $4,193 | $20,571 | $5,347 | $15,224 |
| 2016 | $3,880 | $19,407 | $6,599 | $12,808 |
| 2015 | $2,341 | $19,407 | $9,895 | $9,512 |
| 2014 | $2,341 | $19,233 | $11,768 | $7,465 |
Source: Public Records
Map
Nearby Homes
- 151 Herkimer St
- 15 Verona Place
- 6 Herkimer Ct
- 77 Macon St
- 140 Halsey St
- 1304 Pacific St Unit B1
- 129 Halsey St
- 113 Halsey St
- 175 Halsey St
- 1235 Dean St Unit 4
- 1219 Dean St
- 1352 Pacific St
- 183 Halsey St
- 11A Arlington Place
- 176 Macon St
- 246 Hancock St
- 1251 Pacific St Unit 2 A
- 1251 Pacific St Unit 2
- 1251 Pacific St Unit 4
- 1251 Pacific St Unit 1
- 179 Herkimer St Unit 1
- 179 Herkimer St Unit 3
- 179 Herkimer St Unit 2
- 181 Herkimer St
- 177 Herkimer St
- 177 Herkimer St Unit B
- 177 Herkimer St Unit A
- 177 Herkimer St Unit E
- 177 Herkimer St Unit C
- 177 Herkimer St Unit D
- 177 Herkimer St Unit F
- 175 Herkimer St
- 183 Herkimer St
- 173 Herkimer St
- 173 Herkimer St Unit TOPFLOOR
- 173 Herkimer St Unit GROUNDFLR
- 163 Herkimer St
- 185 Herkimer St
- 161 Herkimer St
- 1320 Fulton St