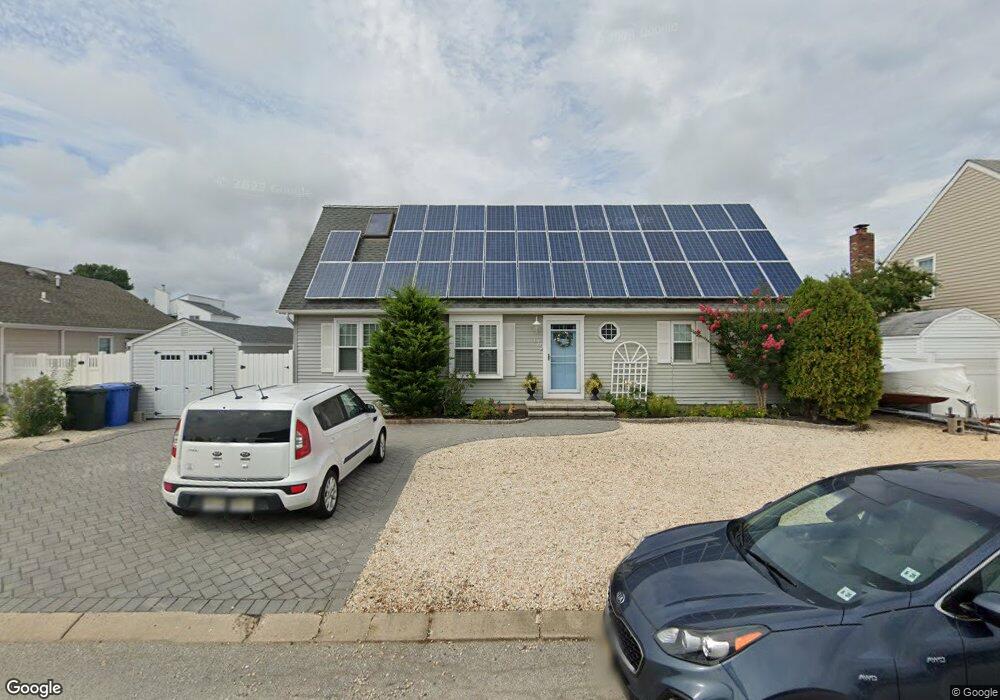
179 Jeremy Ln Manahawkin, NJ 08050
Stafford NeighborhoodEstimated Value: $572,000 - $877,000
4
Beds
2
Baths
1,631
Sq Ft
$473/Sq Ft
Est. Value
About This Home
This home is located at 179 Jeremy Ln, Manahawkin, NJ 08050 and is currently estimated at $772,239, approximately $473 per square foot. 179 Jeremy Ln is a home located in Ocean County with nearby schools including Oxycocus Elementary School, Ocean Acres Elementary School, and McKinley Avenue Elementary School.
Ownership History
Date
Name
Owned For
Owner Type
Purchase Details
Closed on
Dec 18, 2015
Sold by
Vanvanhook Patricia Van
Bought by
Vanvanhook Allison Van
Current Estimated Value
Home Financials for this Owner
Home Financials are based on the most recent Mortgage that was taken out on this home.
Original Mortgage
$208,000
Outstanding Balance
$164,602
Interest Rate
3.89%
Mortgage Type
New Conventional
Estimated Equity
$607,637
Purchase Details
Closed on
Mar 30, 2003
Sold by
Durborow William and Durborow Eileen
Bought by
Vanhook Allen M and Vanhook Patricia L
Home Financials for this Owner
Home Financials are based on the most recent Mortgage that was taken out on this home.
Original Mortgage
$336,600
Interest Rate
6.7%
Mortgage Type
Purchase Money Mortgage
Create a Home Valuation Report for This Property
The Home Valuation Report is an in-depth analysis detailing your home's value as well as a comparison with similar homes in the area
Home Values in the Area
Average Home Value in this Area
Purchase History
| Date | Buyer | Sale Price | Title Company |
|---|---|---|---|
| Vanvanhook Allison Van | $260,000 | Surety Title Agency Coastal | |
| Vanhook Allen M | $384,500 | None Available |
Source: Public Records
Mortgage History
| Date | Status | Borrower | Loan Amount |
|---|---|---|---|
| Open | Vanvanhook Allison Van | $208,000 | |
| Previous Owner | Vanhook Allen M | $336,600 |
Source: Public Records
Tax History Compared to Growth
Tax History
| Year | Tax Paid | Tax Assessment Tax Assessment Total Assessment is a certain percentage of the fair market value that is determined by local assessors to be the total taxable value of land and additions on the property. | Land | Improvement |
|---|---|---|---|---|
| 2025 | $8,832 | $355,700 | $199,800 | $155,900 |
| 2024 | $8,747 | $355,700 | $199,800 | $155,900 |
| 2023 | $8,086 | $355,700 | $199,800 | $155,900 |
| 2022 | $7,975 | $338,800 | $199,800 | $139,000 |
| 2021 | $7,867 | $338,800 | $199,800 | $139,000 |
| 2020 | $7,877 | $338,800 | $199,800 | $139,000 |
| 2019 | $7,765 | $338,800 | $199,800 | $139,000 |
| 2018 | $7,718 | $338,800 | $199,800 | $139,000 |
| 2017 | $7,518 | $319,500 | $180,800 | $138,700 |
| 2016 | $7,441 | $319,500 | $180,800 | $138,700 |
| 2015 | $7,179 | $319,500 | $180,800 | $138,700 |
| 2014 | $7,093 | $311,800 | $178,400 | $133,400 |
Source: Public Records
Map
Nearby Homes