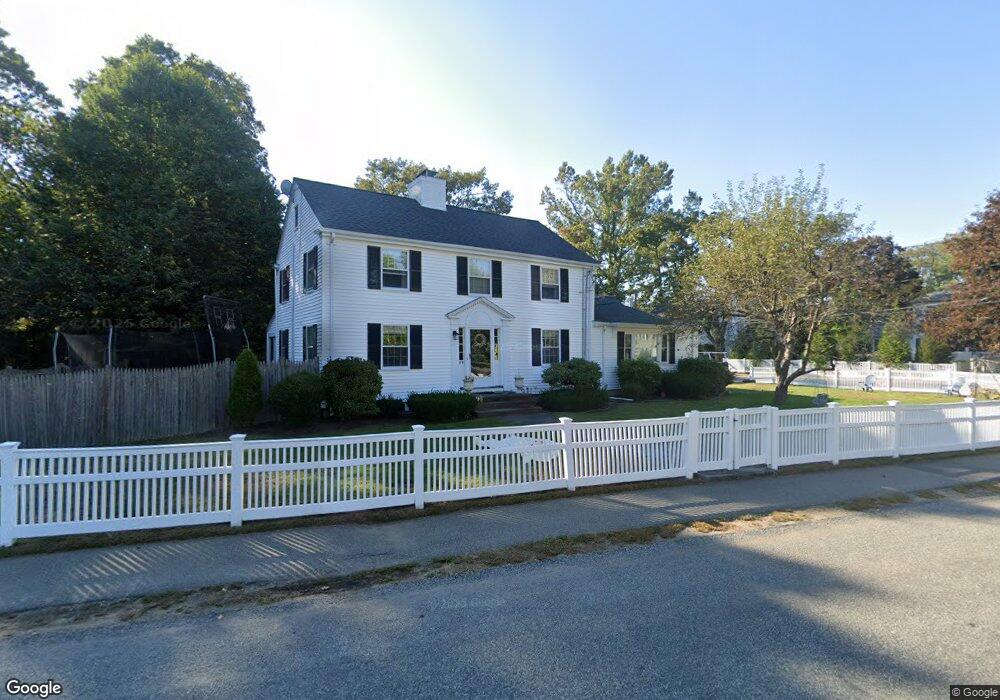
179 Manning St Needham Heights, MA 02494
Estimated Value: $1,556,000 - $1,842,000
3
Beds
3
Baths
1,974
Sq Ft
$854/Sq Ft
Est. Value
About This Home
This home is located at 179 Manning St, Needham Heights, MA 02494 and is currently estimated at $1,684,869, approximately $853 per square foot. 179 Manning St is a home located in Norfolk County with nearby schools including Mitchell Elementary School, High Rock Middle School, and Pollard Middle School.
Ownership History
Date
Name
Owned For
Owner Type
Purchase Details
Closed on
Jul 10, 2006
Sold by
Gilbert Clark and Gilbert Christine
Bought by
Kajunski Daniel T
Current Estimated Value
Purchase Details
Closed on
Sep 28, 2001
Sold by
Brown Ethan J
Bought by
Gilbert Clark and Gilbert Christine
Purchase Details
Closed on
Aug 4, 2000
Sold by
Chaggaris Peter L and Chaggaris Cynthia C
Bought by
Brown Ethan J
Create a Home Valuation Report for This Property
The Home Valuation Report is an in-depth analysis detailing your home's value as well as a comparison with similar homes in the area
Home Values in the Area
Average Home Value in this Area
Purchase History
| Date | Buyer | Sale Price | Title Company |
|---|---|---|---|
| Kajunski Daniel T | $750,000 | -- | |
| Gilbert Clark | $589,000 | -- | |
| Brown Ethan J | $560,000 | -- |
Source: Public Records
Mortgage History
| Date | Status | Borrower | Loan Amount |
|---|---|---|---|
| Open | Brown Ethan J | $405,000 | |
| Closed | Brown Ethan J | $411,000 |
Source: Public Records
Tax History Compared to Growth
Tax History
| Year | Tax Paid | Tax Assessment Tax Assessment Total Assessment is a certain percentage of the fair market value that is determined by local assessors to be the total taxable value of land and additions on the property. | Land | Improvement |
|---|---|---|---|---|
| 2025 | $14,963 | $1,411,600 | $768,600 | $643,000 |
| 2024 | $13,788 | $1,101,300 | $548,900 | $552,400 |
| 2023 | $13,799 | $1,058,200 | $548,900 | $509,300 |
| 2022 | $12,949 | $968,500 | $481,500 | $487,000 |
| 2021 | $12,620 | $968,500 | $481,500 | $487,000 |
| 2020 | $12,464 | $997,900 | $481,800 | $516,100 |
| 2019 | $11,753 | $948,600 | $438,000 | $510,600 |
| 2018 | $11,269 | $948,600 | $438,000 | $510,600 |
| 2017 | $10,555 | $887,700 | $438,000 | $449,700 |
| 2016 | $8,697 | $753,600 | $438,000 | $315,600 |
| 2015 | $8,508 | $753,600 | $438,000 | $315,600 |
| 2014 | $8,198 | $704,300 | $398,200 | $306,100 |
Source: Public Records
Map
Nearby Homes
- 556 Webster St
- 190 Brookline St
- 40 Otis St Unit L
- 42 Otis St Unit R
- 77 High St
- 332 Hillcrest Rd
- 62 Washington Ave
- 445 Hillside Ave
- 26 Pinewood Rd
- 3 Crescent Rd
- 154 Warren St
- 23 Cheney St
- 9 Jayne Rd
- 400 Hunnewell St Unit 103
- 379 Hunnewell St Unit 379
- 143 Hunting Rd
- 36 Davenport Rd
- 71 School St
- 78 Birds Hill Ave
- 34 Pershing Rd
- 166 Lindbergh Ave
- 185 Manning St
- 8 James Ave
- 163 Manning St
- 172 Lindbergh Ave
- 148 Lindbergh Ave
- 191 Manning St
- 165 Lindbergh Ave
- 192 Manning St
- 147 Lindbergh Ave
- 171 Lindbergh Ave
- 178 Lindbergh Ave
- 14 James Ave
- 197 Manning St
- 155 Manning St
- 198 Manning St
- 143 Lindbergh Ave
- 11 James Ave
- 177 Lindbergh Ave
- 17 Fairlawn St