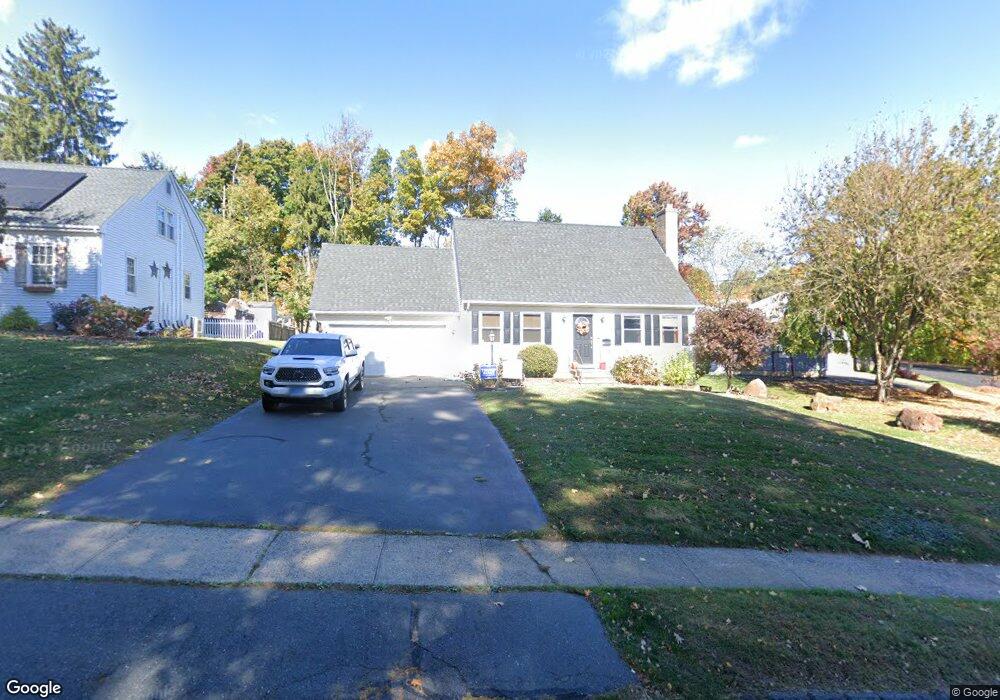
179 Mill St Southington, CT 06489
West Southington NeighborhoodEstimated Value: $390,000 - $442,000
3
Beds
2
Baths
1,373
Sq Ft
$299/Sq Ft
Est. Value
About This Home
This home is located at 179 Mill St, Southington, CT 06489 and is currently estimated at $411,147, approximately $299 per square foot. 179 Mill St is a home located in Hartford County with nearby schools including Urbin T. Kelley Elementary School, Joseph A. Depaolo Middle School, and Southington High School.
Ownership History
Date
Name
Owned For
Owner Type
Purchase Details
Closed on
Jun 27, 2005
Sold by
Charlton Maria L
Bought by
Krasinsky Terri A
Current Estimated Value
Home Financials for this Owner
Home Financials are based on the most recent Mortgage that was taken out on this home.
Original Mortgage
$199,900
Interest Rate
5.82%
Purchase Details
Closed on
Jan 29, 1993
Sold by
Sirois Gary and Zigmund Andrew
Bought by
Charlton Troy and Charlton Maria
Home Financials for this Owner
Home Financials are based on the most recent Mortgage that was taken out on this home.
Original Mortgage
$131,900
Interest Rate
4.75%
Mortgage Type
Unknown
Purchase Details
Closed on
Aug 31, 1992
Sold by
Lepage Homes
Bought by
Sirois Gary and Zigmond Andrew
Create a Home Valuation Report for This Property
The Home Valuation Report is an in-depth analysis detailing your home's value as well as a comparison with similar homes in the area
Home Values in the Area
Average Home Value in this Area
Purchase History
| Date | Buyer | Sale Price | Title Company |
|---|---|---|---|
| Krasinsky Terri A | $259,900 | -- | |
| Charlton Troy | $146,640 | -- | |
| Sirois Gary | $50,000 | -- |
Source: Public Records
Mortgage History
| Date | Status | Borrower | Loan Amount |
|---|---|---|---|
| Open | Sirois Gary | $182,000 | |
| Closed | Sirois Gary | $199,900 | |
| Previous Owner | Sirois Gary | $125,000 | |
| Previous Owner | Sirois Gary | $131,900 |
Source: Public Records
Tax History
| Year | Tax Paid | Tax Assessment Tax Assessment Total Assessment is a certain percentage of the fair market value that is determined by local assessors to be the total taxable value of land and additions on the property. | Land | Improvement |
|---|---|---|---|---|
| 2025 | $5,652 | $170,190 | $53,030 | $117,160 |
| 2024 | $5,351 | $170,190 | $53,030 | $117,160 |
| 2023 | $5,167 | $170,190 | $53,030 | $117,160 |
| 2022 | $4,920 | $168,910 | $53,030 | $115,880 |
| 2021 | $4,903 | $168,910 | $53,030 | $115,880 |
| 2020 | $4,771 | $155,770 | $54,120 | $101,650 |
| 2019 | $4,773 | $155,770 | $54,120 | $101,650 |
| 2018 | $4,748 | $155,770 | $54,120 | $101,650 |
| 2017 | $4,748 | $155,770 | $54,120 | $101,650 |
| 2016 | $4,617 | $155,770 | $54,120 | $101,650 |
| 2015 | $4,494 | $154,220 | $51,540 | $102,680 |
| 2014 | $4,374 | $154,220 | $51,540 | $102,680 |
Source: Public Records
Map
Nearby Homes
- 55 Columbus Blvd Unit 14
- 76 Kane St
- 45 Hart St Unit A
- 15 Wolcott St
- 244 Curtiss St
- 951 Sweetheart Path Unit 951
- 889 Glacier Way Unit 889
- 141 Old Turnpike Rd
- 811 Village Rd Unit 811
- 53 Alder Ln
- 500 Darling St Unit 12J
- 67 Dogwood Dr
- 621 Overlook Path
- 700 Main St
- 1 Coach Dr Unit 1
- 352 Carter Ln
- 82 Grove St
- 85 Clearview Ct Unit 85
- 36 Buckland St Unit 19
- 40 November Ln