Estimated Value: $340,000 - $397,272
4
Beds
3
Baths
2,740
Sq Ft
$135/Sq Ft
Est. Value
About This Home
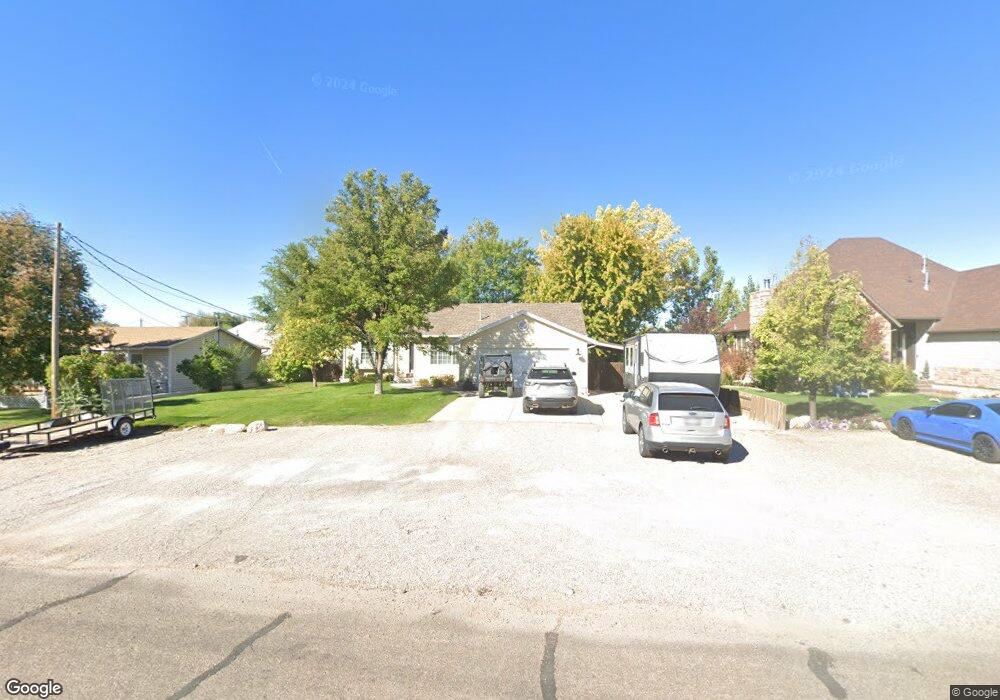
This home is located at 179 N 300 E, Delta, UT 84624 and is currently estimated at $368,818, approximately $134 per square foot. 179 N 300 E is a home located in Millard County with nearby schools including Cba Center and White River Academy.
Ownership History
Date
Name
Owned For
Owner Type
Purchase Details
Closed on
Jul 2, 2018
Sold by
Huntsman Derek Alan and Huntsman Kendra Noel
Bought by
Peterson Denton and Peterson Jerica
Current Estimated Value
Purchase Details
Closed on
Apr 15, 2010
Sold by
Walker Steven A and Walker Kathryn Y
Bought by
Huntsman Derek Alan and Huntsman Kendra Noel
Home Financials for this Owner
Home Financials are based on the most recent Mortgage that was taken out on this home.
Original Mortgage
$159,000
Interest Rate
4.92%
Mortgage Type
New Conventional
Create a Home Valuation Report for This Property
The Home Valuation Report is an in-depth analysis detailing your home's value as well as a comparison with similar homes in the area
Home Values in the Area
Average Home Value in this Area
Purchase History
| Date | Buyer | Sale Price | Title Company |
|---|---|---|---|
| Peterson Denton | -- | -- | |
| Huntsman Derek Alan | -- | -- |
Source: Public Records
Mortgage History
| Date | Status | Borrower | Loan Amount |
|---|---|---|---|
| Previous Owner | Huntsman Derek Alan | $159,000 |
Source: Public Records
Tax History Compared to Growth
Tax History
| Year | Tax Paid | Tax Assessment Tax Assessment Total Assessment is a certain percentage of the fair market value that is determined by local assessors to be the total taxable value of land and additions on the property. | Land | Improvement |
|---|---|---|---|---|
| 2025 | $2,098 | $224,465 | $16,211 | $208,254 |
| 2024 | $2,098 | $198,735 | $12,269 | $186,466 |
| 2023 | $2,446 | $198,735 | $12,269 | $186,466 |
| 2022 | $1,901 | $143,026 | $12,826 | $130,200 |
| 2021 | $1,615 | $115,984 | $9,698 | $106,286 |
| 2020 | $1,293 | $92,266 | $8,817 | $83,449 |
| 2019 | $1,304 | $93,120 | $8,164 | $84,956 |
| 2018 | $1,132 | $81,512 | $8,164 | $73,348 |
| 2017 | $1,171 | $81,274 | $7,926 | $73,348 |
| 2016 | $1,135 | $81,274 | $7,926 | $73,348 |
| 2015 | $1,118 | $80,048 | $7,926 | $72,122 |
| 2014 | -- | $68,142 | $7,941 | $60,201 |
| 2013 | -- | $68,142 | $7,941 | $60,201 |
Source: Public Records
Map
Nearby Homes
- 445 Topaz Blvd Unit 10
- 0 E Highway 6 Unit LotWP001 16586023
- 44 E 300 S
- 7900 E 250 Rd N
- 87 S 300 East Rd
- 321 E 200 S
- 629 E Millard St
- 628 Sunset St
- 325 N 100 W
- Locust Ave Unit LotWP001
- 38 E 300 S
- 32 E 300 S
- 163 W 100 S
- 901 E 750 Rd N
- 625 E Birch Dr
- 786 Bristlecone Ln
- 294 S 300 W
- 451 W 300 N
- 242 S 400 W
- 98 W 1000 N