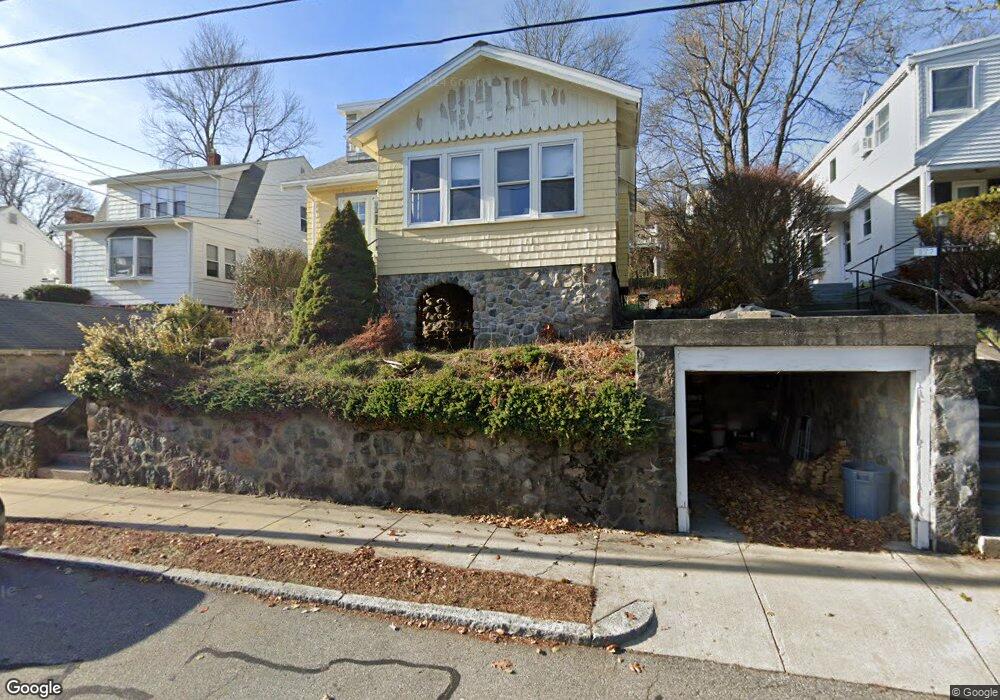
179 Newport St Arlington, MA 02476
Arlington Center NeighborhoodEstimated Value: $959,000 - $1,083,000
2
Beds
1
Bath
1,017
Sq Ft
$998/Sq Ft
Est. Value
About This Home
This home is located at 179 Newport St, Arlington, MA 02476 and is currently estimated at $1,015,280, approximately $998 per square foot. 179 Newport St is a home located in Middlesex County with nearby schools including Brackett Elementary School, Ottoson Middle School, and Arlington High School.
Ownership History
Date
Name
Owned For
Owner Type
Purchase Details
Closed on
Mar 3, 2017
Sold by
Woodcock Jeffrey R and Lyford Jennifer
Bought by
Lyfor Jennifer
Current Estimated Value
Home Financials for this Owner
Home Financials are based on the most recent Mortgage that was taken out on this home.
Original Mortgage
$346,000
Outstanding Balance
$286,282
Interest Rate
4.09%
Mortgage Type
New Conventional
Estimated Equity
$728,998
Purchase Details
Closed on
Feb 27, 2009
Sold by
Moreau Jackson J
Bought by
Woodcock Jeffrey R and Lyford Jennifer
Home Financials for this Owner
Home Financials are based on the most recent Mortgage that was taken out on this home.
Original Mortgage
$272,000
Interest Rate
5%
Mortgage Type
Purchase Money Mortgage
Purchase Details
Closed on
Mar 6, 2007
Sold by
Moreau Joseph C and Moreau Lois S
Bought by
Moreau Jackson J
Create a Home Valuation Report for This Property
The Home Valuation Report is an in-depth analysis detailing your home's value as well as a comparison with similar homes in the area
Home Values in the Area
Average Home Value in this Area
Purchase History
| Date | Buyer | Sale Price | Title Company |
|---|---|---|---|
| Lyfor Jennifer | -- | -- | |
| Woodcock Jeffrey R | $340,000 | -- | |
| Moreau Jackson J | -- | -- |
Source: Public Records
Mortgage History
| Date | Status | Borrower | Loan Amount |
|---|---|---|---|
| Open | Lyfor Jennifer | $346,000 | |
| Previous Owner | Woodcock Jeffrey R | $272,000 |
Source: Public Records
Tax History Compared to Growth
Tax History
| Year | Tax Paid | Tax Assessment Tax Assessment Total Assessment is a certain percentage of the fair market value that is determined by local assessors to be the total taxable value of land and additions on the property. | Land | Improvement |
|---|---|---|---|---|
| 2025 | $9,169 | $851,300 | $496,800 | $354,500 |
| 2024 | $8,464 | $799,200 | $476,900 | $322,300 |
| 2023 | $8,109 | $723,400 | $417,300 | $306,100 |
| 2022 | $7,632 | $668,300 | $397,400 | $270,900 |
| 2021 | $6,640 | $585,500 | $397,400 | $188,100 |
| 2020 | $6,476 | $585,500 | $397,400 | $188,100 |
| 2019 | $6,050 | $537,300 | $372,600 | $164,700 |
| 2018 | $5,450 | $449,300 | $308,000 | $141,300 |
| 2017 | $5,332 | $424,500 | $283,200 | $141,300 |
| 2016 | $5,115 | $399,600 | $258,300 | $141,300 |
| 2015 | $5,339 | $394,000 | $253,400 | $140,600 |
Source: Public Records
Map
Nearby Homes
- 221 Highland Ave
- 152 Scituate St
- 789 Concord Turnpike
- 24 Bellington St
- 39 Chester St
- 11 Stevens Terrace
- 10 Stevens Terrace
- 18 Morton Rd
- 170 Clifton St
- 305 Park Ave
- 33 Newport St
- 10 Radcliffe Rd
- 84 School St
- 43 Brunswick Rd
- 4 Stony Brook Rd
- 119 Gloucester St
- 278 Hillside Ave
- 51 Stella Rd
- 7 Woodland St
- 77 Wellesley Rd
- 177 Newport St
- 181 Newport St
- 182 Scituate St
- 180 Scituate St
- 183 Newport St
- 184 Scituate St
- 182 Newport St
- 178 Scituate St
- 186 Scituate St
- 178 Newport St
- 187 Newport St
- 175 Newport St
- 176 Newport St
- 184 Newport St
- 174 Scituate St
- 188 Scituate St
- 173 Newport St
- 8 Colby Rd
- 189 Newport St
- 186 Newport St