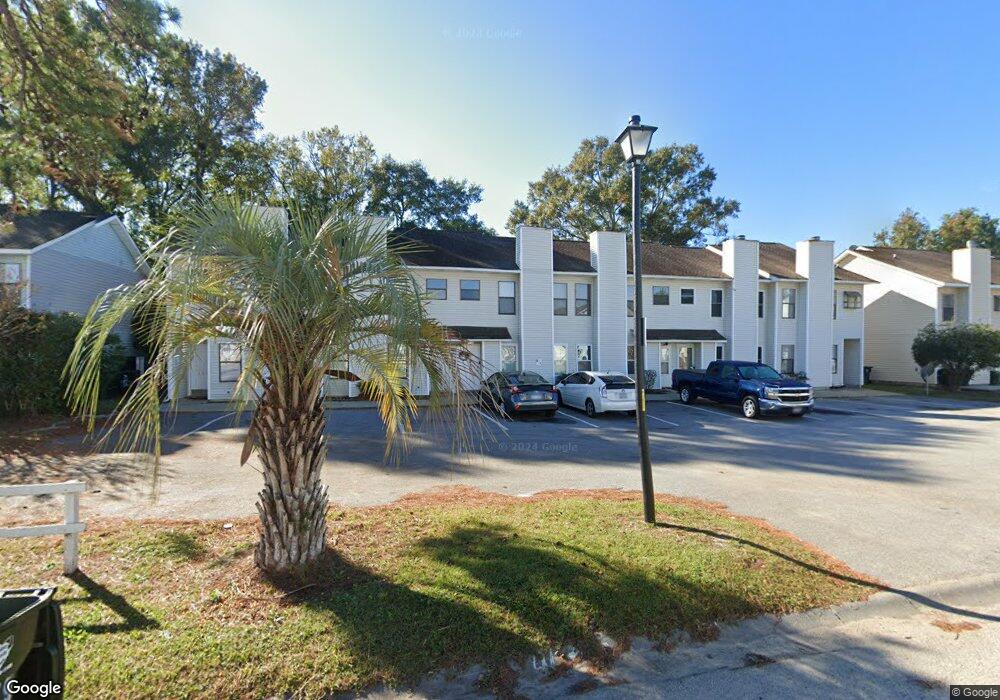
179 Pine Shadow Dr Goose Creek, SC 29445
Estimated Value: $174,000 - $229,638
2
Beds
3
Baths
1,055
Sq Ft
$192/Sq Ft
Est. Value
About This Home
This home is located at 179 Pine Shadow Dr, Goose Creek, SC 29445 and is currently estimated at $202,410, approximately $191 per square foot. 179 Pine Shadow Dr is a home located in Berkeley County with nearby schools including Goose Creek Primary School, Sedgefield Middle School, and Goose Creek High School.
Ownership History
Date
Name
Owned For
Owner Type
Purchase Details
Closed on
Sep 30, 2019
Sold by
Schuler Greg J
Bought by
Ng Hen Fung
Current Estimated Value
Home Financials for this Owner
Home Financials are based on the most recent Mortgage that was taken out on this home.
Original Mortgage
$69,000
Outstanding Balance
$60,447
Interest Rate
3.5%
Mortgage Type
New Conventional
Estimated Equity
$141,963
Purchase Details
Closed on
Dec 31, 2015
Sold by
Mobley Jamie L and Black Jamie Mobley
Bought by
Schuler Greg J
Home Financials for this Owner
Home Financials are based on the most recent Mortgage that was taken out on this home.
Original Mortgage
$37,600
Interest Rate
3.97%
Mortgage Type
New Conventional
Purchase Details
Closed on
Sep 26, 2002
Sold by
Hearne Sharon S B
Bought by
Mobley Jamie L
Create a Home Valuation Report for This Property
The Home Valuation Report is an in-depth analysis detailing your home's value as well as a comparison with similar homes in the area
Home Values in the Area
Average Home Value in this Area
Purchase History
| Date | Buyer | Sale Price | Title Company |
|---|---|---|---|
| Ng Hen Fung | $92,000 | None Available | |
| Schuler Greg J | $47,000 | -- | |
| Mobley Jamie L | $49,000 | -- |
Source: Public Records
Mortgage History
| Date | Status | Borrower | Loan Amount |
|---|---|---|---|
| Open | Ng Hen Fung | $69,000 | |
| Previous Owner | Schuler Greg J | $37,600 |
Source: Public Records
Tax History Compared to Growth
Tax History
| Year | Tax Paid | Tax Assessment Tax Assessment Total Assessment is a certain percentage of the fair market value that is determined by local assessors to be the total taxable value of land and additions on the property. | Land | Improvement |
|---|---|---|---|---|
| 2025 | $1,694 | $102,925 | $17,135 | $85,790 |
| 2024 | $1,694 | $6,175 | $1,028 | $5,147 |
| 2023 | $1,694 | $6,175 | $1,028 | $5,147 |
| 2022 | $1,626 | $5,370 | $900 | $4,470 |
| 2021 | $1,637 | $5,370 | $900 | $4,470 |
| 2020 | $1,643 | $5,370 | $900 | $4,470 |
| 2019 | $1,039 | $4,434 | $600 | $3,834 |
| 2018 | $971 | $2,736 | $180 | $2,556 |
| 2017 | $971 | $2,736 | $180 | $2,556 |
| 2016 | $978 | $2,740 | $180 | $2,560 |
| 2015 | $1,080 | $2,740 | $180 | $2,560 |
| 2014 | $1,017 | $3,250 | $180 | $3,070 |
| 2013 | -- | $3,250 | $180 | $3,070 |
Source: Public Records
Map
Nearby Homes
- 195 Pine Shadow Dr
- 148 Pine Shadow Dr
- 235 Pine Shadow Dr
- 40 Clearwater Dr
- 237 Horseshoe Dr
- 202 Buchanan Cir
- 112 Roselle Ave
- 104 Westminster Cir
- 540 Truman Dr
- 215 Jackson St
- 253 Harding Ln
- 251 Harding Ln
- 249 Harding Ln
- 247 Harding Ln
- 228 Harding Ln
- 226 Harding Ln
- 2023 Bearclaw Dr
- 224 Harding Ln
- 222 Harding Ln
- 241 Harding Ln
- 179 Pineshadow Dr
- 181 Pineshadow Dr Unit 181
- 177 Pineshadow Dr Unit 177
- 183 Pineshadow Dr
- 183 Pine Shadow Dr
- 175 Pine Shadow Dr
- 175 Pineshadow Dr
- 185 Pineshadow Dr
- 185 Pine Shadow Dr
- 173 Pineshadow Dr
- 187 Pineshadow Dr
- 187 Pine Shadow Dr
- 171 Pine Shadow Dr
- 171 Pineshadow Dr
- 0 Pine Shadow Dr
- 189 Pineshadow Dr
- 169 Pineshadow Dr
- 29 Lighthouse Dr
- 27 Lighthouse Dr
- 191 Pineshadow Dr