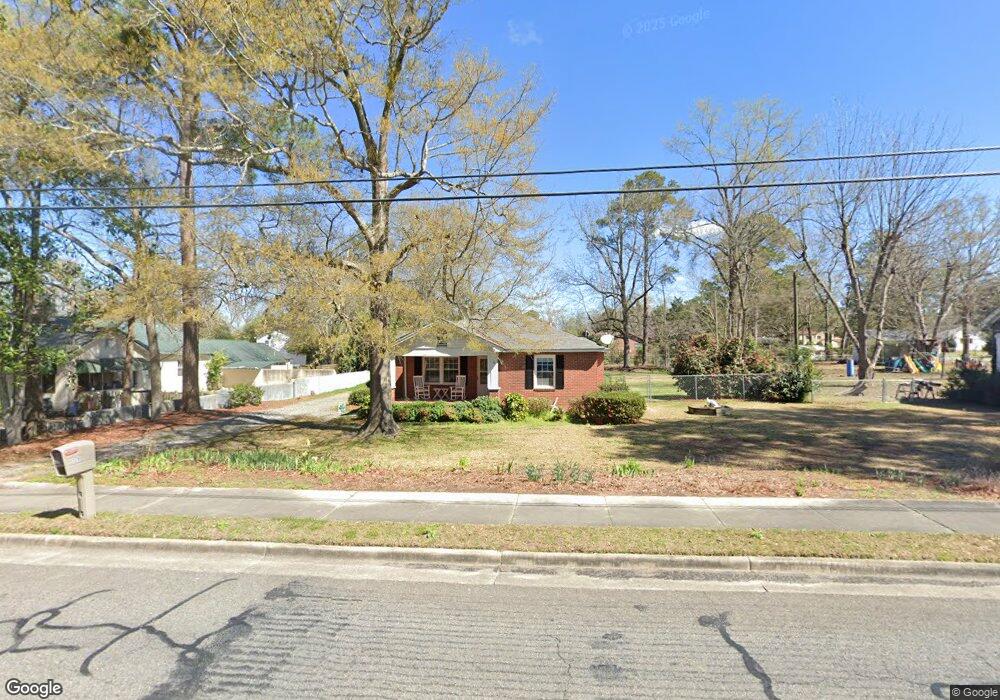
179 S 2nd St Cochran, GA 31014
Estimated Value: $146,000 - $192,000
3
Beds
2
Baths
1,579
Sq Ft
$109/Sq Ft
Est. Value
About This Home
This home is located at 179 S 2nd St, Cochran, GA 31014 and is currently estimated at $172,741, approximately $109 per square foot. 179 S 2nd St is a home located in Bleckley County with nearby schools including Bleckley County Primary School, Bleckley County Elementary School, and Bleckley Middle School.
Ownership History
Date
Name
Owned For
Owner Type
Purchase Details
Closed on
May 30, 2008
Sold by
Walker Dianne M
Bought by
Davidson Mary Kent
Current Estimated Value
Home Financials for this Owner
Home Financials are based on the most recent Mortgage that was taken out on this home.
Original Mortgage
$100,000
Outstanding Balance
$21,774
Interest Rate
6.02%
Mortgage Type
New Conventional
Estimated Equity
$150,967
Purchase Details
Closed on
Jun 4, 2007
Sold by
Tuck Geraldine G
Bought by
Walker Dianne M and Walker Dale L
Home Financials for this Owner
Home Financials are based on the most recent Mortgage that was taken out on this home.
Original Mortgage
$80,000
Interest Rate
6.12%
Mortgage Type
New Conventional
Purchase Details
Closed on
Mar 11, 1999
Sold by
Tuck Geraldine
Bought by
Tuck Geraldine G
Purchase Details
Closed on
Apr 19, 1988
Sold by
Ritacco Anthony F
Bought by
Tuck Geraldine
Purchase Details
Closed on
Aug 29, 1985
Sold by
Chapman Hoyte D
Bought by
Ritacco Anthony F
Purchase Details
Closed on
Aug 23, 1972
Bought by
Chapman Hoyte D
Create a Home Valuation Report for This Property
The Home Valuation Report is an in-depth analysis detailing your home's value as well as a comparison with similar homes in the area
Home Values in the Area
Average Home Value in this Area
Purchase History
| Date | Buyer | Sale Price | Title Company |
|---|---|---|---|
| Davidson Mary Kent | $107,000 | -- | |
| Walker Dianne M | $100,000 | -- | |
| Tuck Geraldine G | -- | -- | |
| Tuck Geraldine | -- | -- | |
| Ritacco Anthony F | -- | -- | |
| Chapman Hoyte D | -- | -- |
Source: Public Records
Mortgage History
| Date | Status | Borrower | Loan Amount |
|---|---|---|---|
| Open | Davidson Mary Kent | $100,000 | |
| Previous Owner | Walker Dianne M | $80,000 |
Source: Public Records
Tax History Compared to Growth
Tax History
| Year | Tax Paid | Tax Assessment Tax Assessment Total Assessment is a certain percentage of the fair market value that is determined by local assessors to be the total taxable value of land and additions on the property. | Land | Improvement |
|---|---|---|---|---|
| 2024 | $1,757 | $51,700 | $4,080 | $47,620 |
| 2023 | $1,917 | $51,700 | $4,080 | $47,620 |
| 2022 | $1,059 | $46,020 | $4,080 | $41,940 |
| 2021 | $812 | $35,620 | $4,080 | $31,540 |
| 2020 | $816 | $35,620 | $4,080 | $31,540 |
| 2019 | $871 | $37,558 | $6,000 | $31,558 |
| 2018 | $1,519 | $37,558 | $6,000 | $31,558 |
| 2017 | $883 | $37,558 | $6,000 | $31,558 |
| 2016 | $893 | $37,558 | $6,000 | $31,558 |
| 2015 | -- | $37,558 | $6,000 | $31,558 |
| 2014 | -- | $37,558 | $6,000 | $31,558 |
| 2013 | -- | $37,558 | $6,000 | $31,558 |
Source: Public Records
Map
Nearby Homes
- 142 Rose St
- 134 Easy St
- 115 Plantation Dr
- 119 S 4th St
- 0 Willow Creek Run
- 116 Pecan St
- 112 Pecan St
- 114 Pecan St
- 123 S 5th St
- 118 S 5th St
- 1277 Georgia 112
- 0 Tiffany Dr Unit 10525322
- 140 Racetrack Dr
- 105 Hillcrest Dr
- RV Park Mac Thompson Rd
- Land Mac Thompson Rd
- 124 Pine Hill Dr
- 157 10th St SE
- 119 Moll Dr
- 150 Wood Oak Cir
- 183 S 2nd St
- 175 Second Street Ln
- 173 Second Street Ln
- 178 S 2nd St
- 189 S 2nd St
- 182 S 3rd St
- 174 S 2nd St
- 178 S 3rd St
- 106 E Peacock St
- 171 S 2nd St
- 184 S 3rd St
- 176 S 3rd St
- 105 Lewis Ln
- 176 S 3rd St
- 112 S 2nd St
- 172 S 2nd St
- 172 SE 2nd St
- Trac D-2 Honeysuckle Trace
- 191 Second Street Ln
- 172 S 3rd St