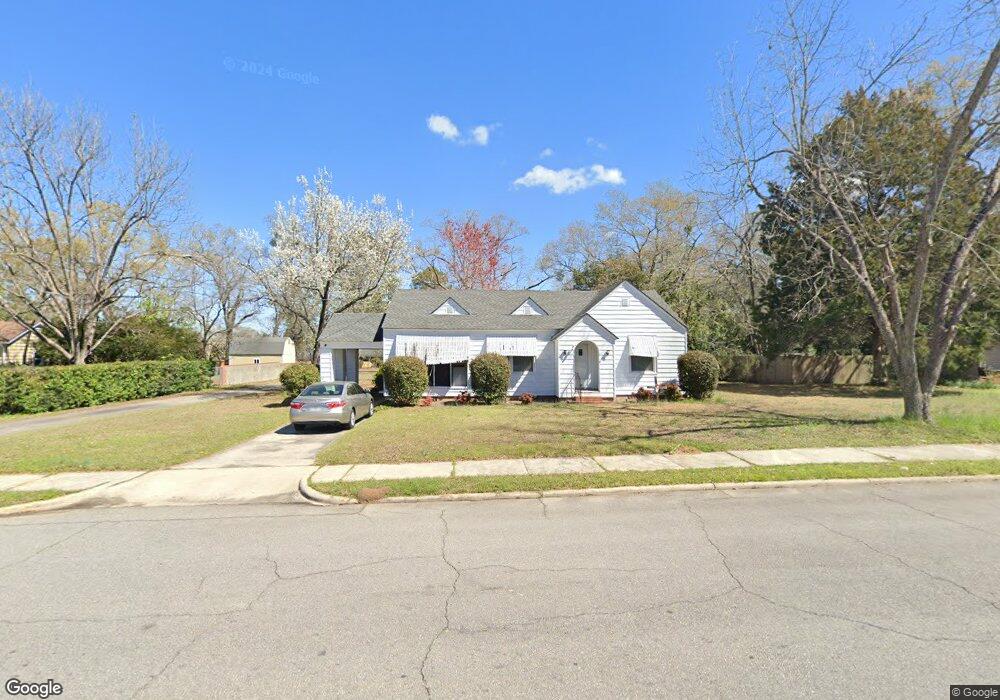
179 S 3rd St Cochran, GA 31014
Estimated Value: $148,000 - $164,000
3
Beds
1
Bath
1,533
Sq Ft
$100/Sq Ft
Est. Value
About This Home
This home is located at 179 S 3rd St, Cochran, GA 31014 and is currently estimated at $153,041, approximately $99 per square foot. 179 S 3rd St is a home located in Bleckley County with nearby schools including Bleckley County Primary School, Bleckley County Elementary School, and Bleckley Middle School.
Ownership History
Date
Name
Owned For
Owner Type
Purchase Details
Closed on
Apr 18, 2023
Sold by
Mullis Dale H
Bought by
Williams Elizabeth
Current Estimated Value
Home Financials for this Owner
Home Financials are based on the most recent Mortgage that was taken out on this home.
Original Mortgage
$111,400
Outstanding Balance
$107,961
Interest Rate
6.42%
Mortgage Type
New Conventional
Estimated Equity
$45,080
Purchase Details
Closed on
Dec 19, 2008
Sold by
Mullis Ella S
Bought by
Mullis Dale H
Home Financials for this Owner
Home Financials are based on the most recent Mortgage that was taken out on this home.
Original Mortgage
$40,000
Interest Rate
5.96%
Mortgage Type
New Conventional
Purchase Details
Closed on
Dec 30, 1997
Sold by
Mullis Charlie M
Bought by
Mullis Ella S
Purchase Details
Closed on
Dec 19, 1939
Bought by
Mullis Charlie M
Create a Home Valuation Report for This Property
The Home Valuation Report is an in-depth analysis detailing your home's value as well as a comparison with similar homes in the area
Home Values in the Area
Average Home Value in this Area
Purchase History
| Date | Buyer | Sale Price | Title Company |
|---|---|---|---|
| Williams Elizabeth | $139,400 | -- | |
| Mullis Dale H | $50,000 | -- | |
| Mullis Ella S | -- | -- | |
| Mullis Charlie M | -- | -- |
Source: Public Records
Mortgage History
| Date | Status | Borrower | Loan Amount |
|---|---|---|---|
| Open | Williams Elizabeth | $111,400 | |
| Previous Owner | Mullis Dale H | $40,000 |
Source: Public Records
Tax History
| Year | Tax Paid | Tax Assessment Tax Assessment Total Assessment is a certain percentage of the fair market value that is determined by local assessors to be the total taxable value of land and additions on the property. | Land | Improvement |
|---|---|---|---|---|
| 2025 | $1,708 | $47,136 | $3,920 | $43,216 |
| 2024 | $1,723 | $47,136 | $3,920 | $43,216 |
| 2023 | $1,870 | $47,136 | $3,920 | $43,216 |
| 2022 | $1,087 | $41,936 | $3,920 | $38,016 |
| 2021 | $862 | $32,336 | $3,920 | $28,416 |
| 2020 | $865 | $32,336 | $3,920 | $28,416 |
| 2019 | $559 | $21,586 | $5,760 | $15,826 |
| 2018 | $873 | $21,586 | $5,760 | $15,826 |
| 2017 | $566 | $21,586 | $5,760 | $15,826 |
| 2016 | $571 | $21,586 | $5,760 | $15,826 |
| 2015 | -- | $21,586 | $5,760 | $15,826 |
| 2014 | -- | $21,586 | $5,760 | $15,826 |
| 2013 | -- | $21,585 | $5,760 | $15,825 |
Source: Public Records
Map
Nearby Homes
- 116 W Lewis St
- 188 E Lewis St
- 104 S 4th St
- 134 Easy St
- 0 Tiffany Dr Unit 10664262
- 132 Mcvay Dr
- 0 Willow Creek Run
- 1277 Georgia 112
- 216 E Peter St
- 116 Pecan St
- 118 Pecan St
- 112 Pecan St
- 161 E Cherry St
- 113 Taylor Dr
- 140 Racetrack Dr
- 169 W Dykes St
- RV Park Mac Thompson Rd
- Land Mac Thompson Rd
- 260 Ann St
- 264 Ann St
Your Personal Tour Guide
Ask me questions while you tour the home.