179 Tamarack Ln Barrington, IL 60010
Estimated Value: $671,000 - $729,726
4
Beds
2
Baths
2,204
Sq Ft
$317/Sq Ft
Est. Value
About This Home
This home is located at 179 Tamarack Ln, Barrington, IL 60010 and is currently estimated at $698,682, approximately $317 per square foot. 179 Tamarack Ln is a home located in Cook County with nearby schools including Countryside Elementary School, Barrington Mdle School- Prairie Cmps, and Barrington High School.
Ownership History
Date
Name
Owned For
Owner Type
Purchase Details
Closed on
Dec 6, 2012
Sold by
Trace Construction Inc
Bought by
Pollard B G and Pollard C A
Current Estimated Value
Purchase Details
Closed on
Oct 22, 2012
Sold by
Swiderski Antoni and Halcisakova Anna
Bought by
Trace Construction Inc
Purchase Details
Closed on
Jun 10, 2005
Sold by
Ekman Frank O
Bought by
Swiderski Antoni and Halcisakova Anna
Home Financials for this Owner
Home Financials are based on the most recent Mortgage that was taken out on this home.
Original Mortgage
$450,000
Interest Rate
5.86%
Mortgage Type
New Conventional
Create a Home Valuation Report for This Property
The Home Valuation Report is an in-depth analysis detailing your home's value as well as a comparison with similar homes in the area
Home Values in the Area
Average Home Value in this Area
Purchase History
| Date | Buyer | Sale Price | Title Company |
|---|---|---|---|
| Pollard B G | -- | Chicago Title Insurance Comp | |
| Trace Construction Inc | $290,000 | None Available | |
| Swiderski Antoni | $600,000 | -- |
Source: Public Records
Mortgage History
| Date | Status | Borrower | Loan Amount |
|---|---|---|---|
| Open | Pollard Bg | $295,000 | |
| Closed | Pollard B G | $203,500 | |
| Closed | Pollard Ben G | $200,000 | |
| Closed | Pollard Benjamin G | $200,000 | |
| Previous Owner | Halcisakova Anna | $49,500 | |
| Previous Owner | Swiderski Antoni | $548,000 | |
| Previous Owner | Swiderski Antoni | $95,000 | |
| Previous Owner | Swiderski Antoni | $450,000 |
Source: Public Records
Tax History Compared to Growth
Tax History
| Year | Tax Paid | Tax Assessment Tax Assessment Total Assessment is a certain percentage of the fair market value that is determined by local assessors to be the total taxable value of land and additions on the property. | Land | Improvement |
|---|---|---|---|---|
| 2024 | $10,462 | $47,000 | $21,780 | $25,220 |
| 2023 | $10,189 | $47,000 | $21,780 | $25,220 |
| 2022 | $10,189 | $47,000 | $21,780 | $25,220 |
| 2021 | $9,252 | $37,890 | $21,780 | $16,110 |
| 2020 | $9,039 | $37,890 | $21,780 | $16,110 |
| 2019 | $8,794 | $42,100 | $21,780 | $20,320 |
| 2018 | $12,048 | $55,295 | $16,335 | $38,960 |
| 2017 | $11,797 | $55,295 | $16,335 | $38,960 |
| 2016 | $11,353 | $55,295 | $16,335 | $38,960 |
| 2015 | $13,248 | $57,615 | $10,890 | $46,725 |
| 2014 | $13,236 | $57,615 | $10,890 | $46,725 |
| 2013 | $13,985 | $60,550 | $10,890 | $49,660 |
Source: Public Records
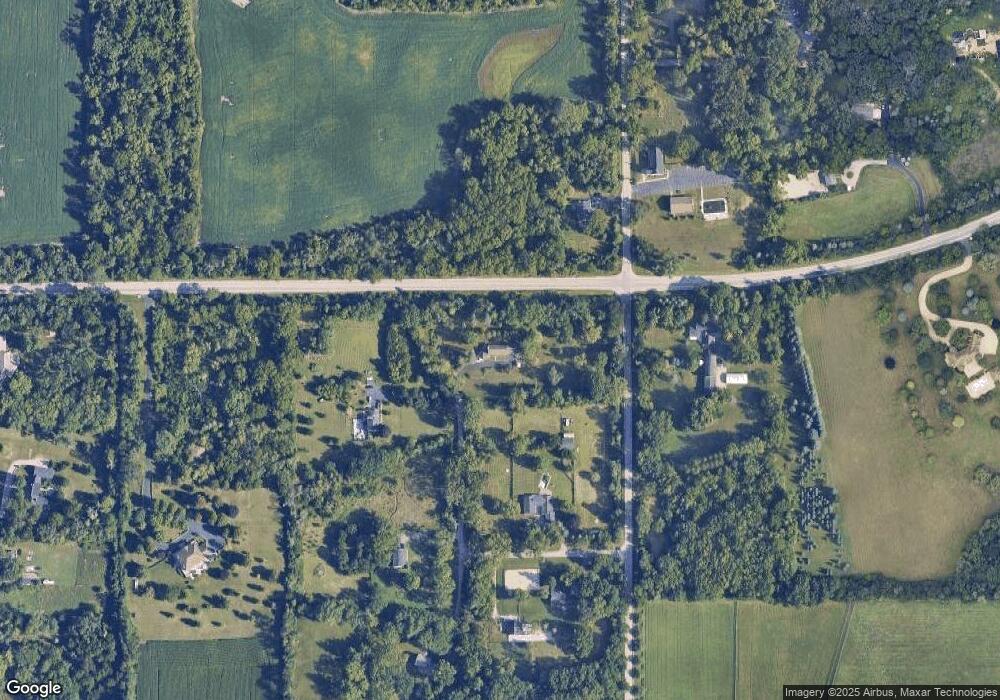
Map
Nearby Homes
- 180A Old Sutton Rd
- 2 Tricia Ln
- 189 Old Sutton Rd
- 28 Shenandoah Cir
- 309 Dundee Rd
- 316 Old Sutton Rd
- 8 Brooke Ln
- 4 Kaleigh Ct
- 22 Westlake Dr
- 190 & Rt 59 W Penny Rd
- 60 Wood Oaks Dr
- 10 Shoreside Dr
- 3 Shoreside Dr
- 43 Wood Oaks Dr
- 12 Leanda Ct
- 513 Pond Gate Dr
- 1 Leanda Ln
- 3 Leanda Ln
- 20 Bighorn Ct
- 33 N Liberty Dr
- 179 Tamarack Ln
- 179 Tamarack Ln
- 179 Tamarack Ln
- 180 Old Sutton Rd
- 180 Old Sutton Rd
- 170 Dundee Rd
- 170 Dundee Rd
- 180 Old Sutton Rd
- 180 Old Sutton Rd
- 180 B Old Sutton Rd
- 179B Tamarack Ln
- 179A Tamarack Ln
- 179C Tamarack Ln
- 179E Old Sutton Rd
- 180A Old Sutton Rd
- 177C Dundee Rd
- 183 Old Sutton Rd
- 179G Tamarack Ln
- 15N701 Old Sutton Rd
- 15N803 Old Sutton Rd