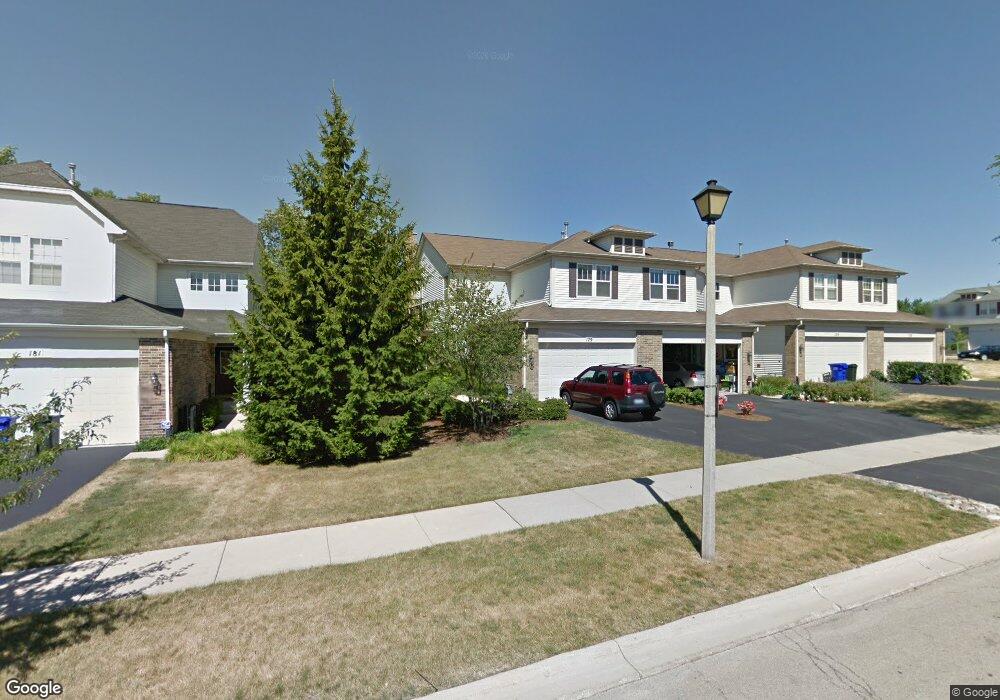
179 Tanglewood Dr Glen Ellyn, IL 60137
Estimated Value: $434,000 - $619,000
3
Beds
2
Baths
1,843
Sq Ft
$268/Sq Ft
Est. Value
About This Home
This home is located at 179 Tanglewood Dr, Glen Ellyn, IL 60137 and is currently estimated at $494,517, approximately $268 per square foot. 179 Tanglewood Dr is a home located in DuPage County with nearby schools including Westfield Elementary School, Glen Crest Middle School, and Glenbard South High School.
Ownership History
Date
Name
Owned For
Owner Type
Purchase Details
Closed on
Jun 27, 2024
Sold by
Salins Susan M and Salins Sean E
Bought by
Sean E Salins Trust and Susan M Salins Trust
Current Estimated Value
Purchase Details
Closed on
Jul 24, 2001
Sold by
Debbiche Mohamed S and Debbiche Felice M
Bought by
Salins Sean E and Salins Susan M
Home Financials for this Owner
Home Financials are based on the most recent Mortgage that was taken out on this home.
Original Mortgage
$241,400
Interest Rate
7.14%
Purchase Details
Closed on
Dec 10, 1999
Sold by
Pinnacle Corp
Bought by
Debbiche Mohamed S and Debbiche Felice M
Home Financials for this Owner
Home Financials are based on the most recent Mortgage that was taken out on this home.
Original Mortgage
$120,500
Interest Rate
7.12%
Create a Home Valuation Report for This Property
The Home Valuation Report is an in-depth analysis detailing your home's value as well as a comparison with similar homes in the area
Home Values in the Area
Average Home Value in this Area
Purchase History
| Date | Buyer | Sale Price | Title Company |
|---|---|---|---|
| Sean E Salins Trust | -- | None Listed On Document | |
| Salins Sean E | $284,000 | Lawyers Title Pick Up | |
| Debbiche Mohamed S | $249,500 | Chicago Title Insurance Co |
Source: Public Records
Mortgage History
| Date | Status | Borrower | Loan Amount |
|---|---|---|---|
| Previous Owner | Salins Sean E | $241,400 | |
| Previous Owner | Debbiche Mohamed S | $120,500 | |
| Closed | Salins Sean E | $14,170 |
Source: Public Records
Tax History Compared to Growth
Tax History
| Year | Tax Paid | Tax Assessment Tax Assessment Total Assessment is a certain percentage of the fair market value that is determined by local assessors to be the total taxable value of land and additions on the property. | Land | Improvement |
|---|---|---|---|---|
| 2024 | $8,815 | $127,185 | $12,461 | $114,724 |
| 2023 | $8,380 | $117,070 | $11,470 | $105,600 |
| 2022 | $8,276 | $114,190 | $10,840 | $103,350 |
| 2021 | $8,006 | $111,480 | $10,580 | $100,900 |
| 2020 | $8,032 | $110,440 | $10,480 | $99,960 |
| 2019 | $7,831 | $107,520 | $10,200 | $97,320 |
| 2018 | $6,857 | $94,130 | $9,620 | $84,510 |
| 2017 | $6,346 | $90,650 | $9,260 | $81,390 |
| 2016 | $6,307 | $87,030 | $8,890 | $78,140 |
| 2015 | $6,277 | $83,030 | $8,480 | $74,550 |
| 2014 | $7,466 | $95,810 | $9,350 | $86,460 |
| 2013 | $7,228 | $96,100 | $9,380 | $86,720 |
Source: Public Records
Map
Nearby Homes
- 130 Tanglewood Dr
- 153 Grove Ave
- 61 Grove Ave
- 953 Oxford Rd
- 243 Bryant Ave
- 832 N Driveway
- 734 Highview Ave
- 670 Revere Rd
- 82 Valley Rd
- 725 Kingsbrook Glen
- 83 N Park Blvd
- 789 Hill Ave
- 143 Harding Ct
- 131 Harding Ct
- 129 Harding Ct
- 606 Lakeview Terrace
- 397 Taylor Ave
- 21W230 Pershing Ave
- 14931 Parkview Blvd
- 562 Summerdale Ave
- 177 Tanglewood Dr
- 175 Tanglewood Dr
- 181 Tanglewood Dr
- 173 Tanglewood Dr
- 183 Tanglewood Dr
- 149 Tanglewood Dr
- 185 Tanglewood Dr Unit 32185
- 151 Tanglewood Dr Unit 143
- 145 Tanglewood Dr
- 187 Tanglewood Dr
- 143 Tanglewood Dr
- 124 Woodview Ct
- 126 Woodview Ct
- 174 Tanglewood Dr
- 174 Tanglewood Dr Unit 174
- 130 Woodview Ct
- 178 Tanglewood Dr
- 180 Tanglewood Dr
- 141 Tanglewood Dr
- 182 Tanglewood Dr