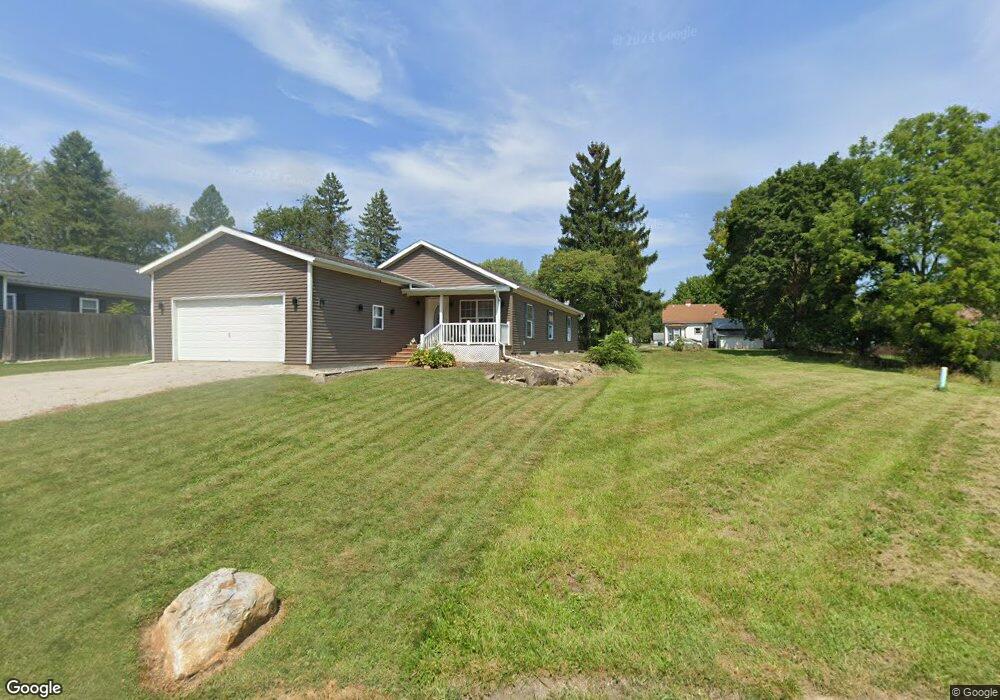
179 Thomas St Tiffin, OH 44883
Estimated Value: $74,000 - $135,000
3
Beds
2
Baths
1,404
Sq Ft
$76/Sq Ft
Est. Value
About This Home
This home is located at 179 Thomas St, Tiffin, OH 44883 and is currently estimated at $107,000, approximately $76 per square foot. 179 Thomas St is a home located in Seneca County with nearby schools including Columbian High School, Calvert Catholic Elementary School, and Calvert High School.
Ownership History
Date
Name
Owned For
Owner Type
Purchase Details
Closed on
Oct 6, 2020
Sold by
Houck Roselia C
Bought by
Houck Warren R
Current Estimated Value
Purchase Details
Closed on
Jul 13, 2011
Sold by
National Banking Assn
Bought by
Houck Rosella C
Purchase Details
Closed on
Apr 23, 2010
Sold by
Kg & R Development Corp
Bought by
Fith Third Bank
Purchase Details
Closed on
Sep 14, 2004
Bought by
Kg & R Development
Create a Home Valuation Report for This Property
The Home Valuation Report is an in-depth analysis detailing your home's value as well as a comparison with similar homes in the area
Home Values in the Area
Average Home Value in this Area
Purchase History
| Date | Buyer | Sale Price | Title Company |
|---|---|---|---|
| Houck Warren R | -- | None Available | |
| Houck Rosella C | $34,000 | None Available | |
| Fith Third Bank | $53,334 | None Available | |
| Kg & R Development | $44,000 | -- |
Source: Public Records
Tax History Compared to Growth
Tax History
| Year | Tax Paid | Tax Assessment Tax Assessment Total Assessment is a certain percentage of the fair market value that is determined by local assessors to be the total taxable value of land and additions on the property. | Land | Improvement |
|---|---|---|---|---|
| 2024 | $1,439 | $41,620 | $4,600 | $37,020 |
| 2023 | $1,441 | $41,620 | $4,600 | $37,020 |
| 2022 | $1,237 | $29,670 | $4,570 | $25,100 |
| 2021 | $1,246 | $29,670 | $4,570 | $25,100 |
| 2020 | $1,270 | $29,663 | $4,568 | $25,095 |
| 2019 | $1,277 | $29,579 | $4,557 | $25,022 |
| 2018 | $1,364 | $29,579 | $4,557 | $25,022 |
| 2017 | $1,408 | $29,579 | $4,557 | $25,022 |
| 2016 | $1,208 | $28,329 | $4,326 | $24,003 |
| 2015 | $1,195 | $28,329 | $4,326 | $24,003 |
| 2014 | $1,125 | $28,329 | $4,326 | $24,003 |
| 2013 | $1,680 | $29,824 | $4,557 | $25,267 |
Source: Public Records
Map
Nearby Homes