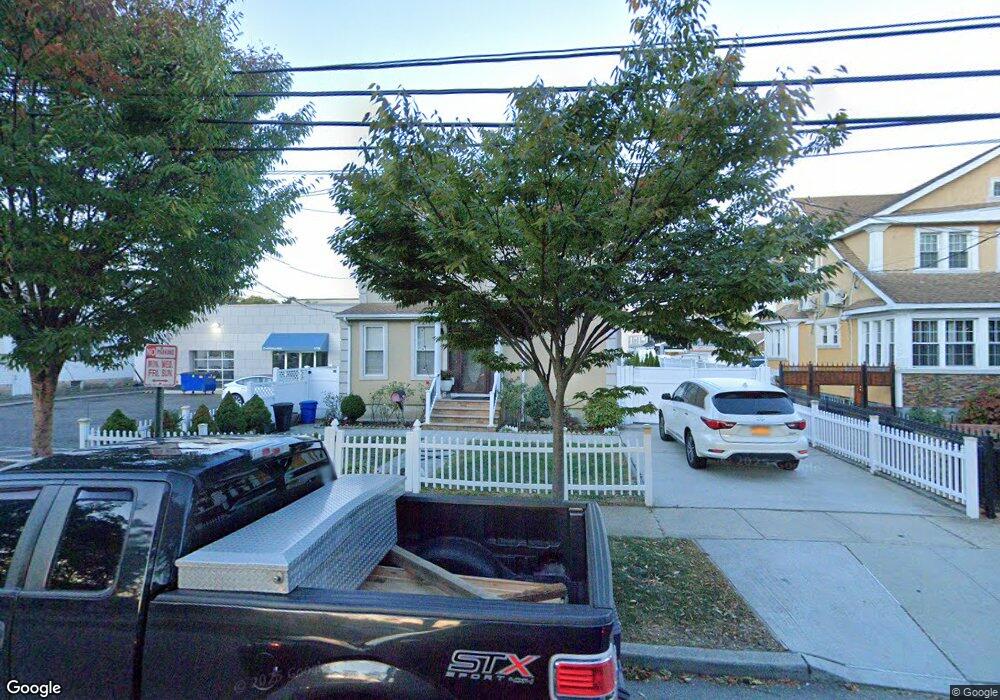
179 Vincent Ave Lynbrook, NY 11563
Estimated Value: $864,000 - $870,267
--
Bed
3
Baths
2,490
Sq Ft
$348/Sq Ft
Est. Value
About This Home
This home is located at 179 Vincent Ave, Lynbrook, NY 11563 and is currently estimated at $867,134, approximately $348 per square foot. 179 Vincent Ave is a home located in Nassau County with nearby schools including Lynbrook Senior High School and Our Lady Of Peace School.
Ownership History
Date
Name
Owned For
Owner Type
Purchase Details
Closed on
Mar 22, 2018
Sold by
84 Dynamic Llc
Bought by
Singh Tarvinder and Sambhi Sandeep K
Current Estimated Value
Home Financials for this Owner
Home Financials are based on the most recent Mortgage that was taken out on this home.
Original Mortgage
$169,600
Outstanding Balance
$97,714
Interest Rate
4.4%
Mortgage Type
New Conventional
Estimated Equity
$769,420
Purchase Details
Closed on
Jun 16, 2016
Sold by
Referee Of Nassau County and Ricciardi Esq
Bought by
84 Dynamic Llc
Purchase Details
Closed on
Jan 19, 2005
Sold by
Hurtado Anamaria
Bought by
179 Vincent Holding Corp
Purchase Details
Closed on
Dec 20, 1996
Sold by
Schuman Herbert and Schuman Mabel
Bought by
Hurtado Ana Maria
Create a Home Valuation Report for This Property
The Home Valuation Report is an in-depth analysis detailing your home's value as well as a comparison with similar homes in the area
Home Values in the Area
Average Home Value in this Area
Purchase History
| Date | Buyer | Sale Price | Title Company |
|---|---|---|---|
| Singh Tarvinder | $212,000 | Old Republic Title | |
| Singh Tarvinder | $212,000 | Old Republic Title | |
| 84 Dynamic Llc | $331,000 | None Available | |
| 84 Dynamic Llc | $331,000 | None Available | |
| 179 Vincent Holding Corp | $250,000 | -- | |
| 179 Vincent Holding Corp | $250,000 | -- | |
| Hurtado Ana Maria | $172,500 | -- | |
| Hurtado Ana Maria | $172,500 | -- |
Source: Public Records
Mortgage History
| Date | Status | Borrower | Loan Amount |
|---|---|---|---|
| Open | Singh Tarvinder | $169,600 | |
| Closed | Singh Tarvinder | $169,600 | |
| Closed | 84 Dynamic Llc | $0 |
Source: Public Records
Tax History Compared to Growth
Tax History
| Year | Tax Paid | Tax Assessment Tax Assessment Total Assessment is a certain percentage of the fair market value that is determined by local assessors to be the total taxable value of land and additions on the property. | Land | Improvement |
|---|---|---|---|---|
| 2025 | $11,052 | $535 | $248 | $287 |
| 2024 | $976 | $537 | $249 | $288 |
| 2023 | $9,669 | $567 | $190 | $377 |
| 2022 | $9,669 | $550 | $255 | $295 |
| 2021 | $15,458 | $550 | $223 | $327 |
| 2020 | $10,163 | $747 | $520 | $227 |
| 2019 | $1,316 | $839 | $479 | $360 |
| 2018 | $10,709 | $1,023 | $0 | $0 |
| 2017 | $11,489 | $1,023 | $584 | $439 |
| 2016 | $12,967 | $1,023 | $584 | $439 |
| 2015 | $1,519 | $1,023 | $584 | $439 |
| 2014 | $1,519 | $1,023 | $584 | $439 |
| 2013 | $1,394 | $1,023 | $584 | $439 |
Source: Public Records
Map
Nearby Homes
- 9 Watkins St
- 266 Earle Ave
- 45 Lynbrook Ave
- 60 Hempstead Ave Unit 1K
- 60 Hempstead Ave Unit 1H
- 60 Hempstead Ave Unit 1O
- 60 Hempstead Ave Unit 1J
- 54 Lynbrook Ave
- 40 Daley Place Unit 124
- 40 Daley Place Unit 233
- 59 Manor Rd
- 114 Atlantic Ave Unit 89
- 92 Walnut St
- 4 Hilton St
- 291 Denton Ave
- 65 Earle Ave
- 75 Noble St Unit 219
- 75 Noble St Unit 126
- 142 Rocklyn Ave
- 160 Rocklyn Ave
- 183 Vincent Ave
- 175 Vincent Ave
- 187 Vincent Ave
- 187 Vincent Ave Unit 2
- 182 Earle Ave
- 197 Vincent Ave Unit 2A
- 236 Merrick Rd
- 232 Merrick Rd
- 232 Merrick Rd Unit 2A
- 252 Merrick Rd
- 250 Merrick Rd
- 246 Merrick Rd Unit 254
- 244 Merrick Rd
- 248 Merrick Rd
- 244 Merrick Rd Unit 254
- 246 Merrick Rd
- 246 Merrick Rd
- 252 Merrick Rd
- 250 Merrick Rd
- 226 Merrick Rd