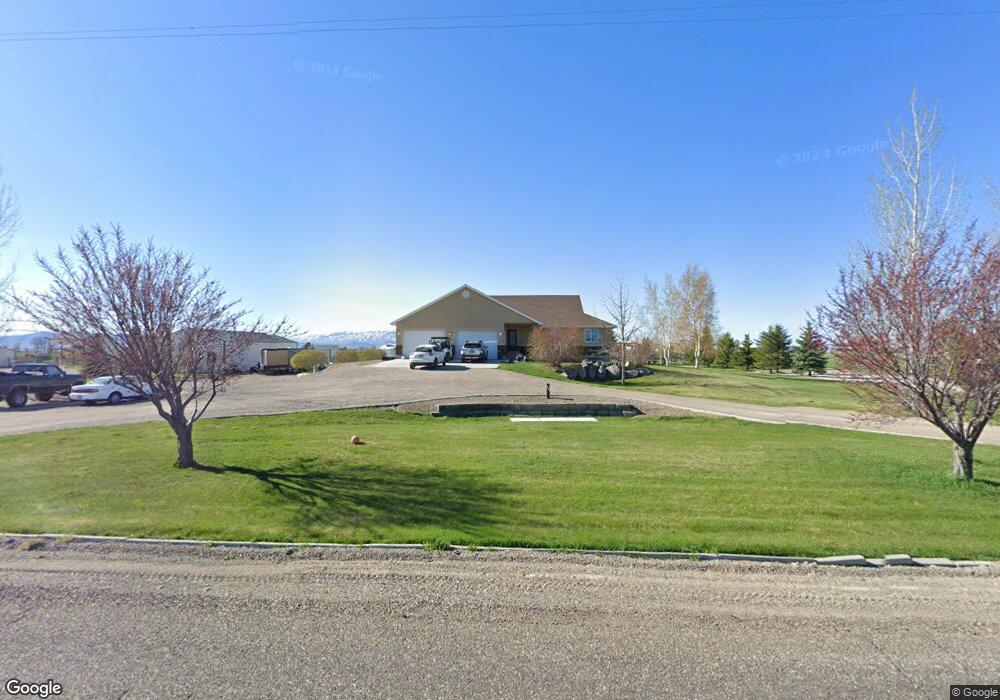
179 W 200 S Rupert, ID 83350
Estimated Value: $543,000 - $722,247
4
Beds
2
Baths
3,904
Sq Ft
$167/Sq Ft
Est. Value
About This Home
This home is located at 179 W 200 S, Rupert, ID 83350 and is currently estimated at $650,082, approximately $166 per square foot. 179 W 200 S is a home located in Minidoka County with nearby schools including Heyburn Elementary School, Minico Senior High School, and Artec Charter School.
Ownership History
Date
Name
Owned For
Owner Type
Purchase Details
Closed on
Jun 21, 2021
Sold by
Dansie Jed and Dansie Makayla
Bought by
Dansie Jed Elmer and Dansie Makayla Ann
Current Estimated Value
Home Financials for this Owner
Home Financials are based on the most recent Mortgage that was taken out on this home.
Original Mortgage
$300,500
Outstanding Balance
$272,065
Interest Rate
2.9%
Mortgage Type
New Conventional
Estimated Equity
$378,017
Purchase Details
Closed on
Jul 27, 2018
Sold by
Taylor Benjamin
Bought by
Dansie Jed and Dansie Makayia
Home Financials for this Owner
Home Financials are based on the most recent Mortgage that was taken out on this home.
Original Mortgage
$300,000
Interest Rate
6.37%
Mortgage Type
Adjustable Rate Mortgage/ARM
Purchase Details
Closed on
Apr 12, 2006
Sold by
Blair Russell and Blair Rose W
Bought by
Dansie Jed and Dansie Makayla
Create a Home Valuation Report for This Property
The Home Valuation Report is an in-depth analysis detailing your home's value as well as a comparison with similar homes in the area
Home Values in the Area
Average Home Value in this Area
Purchase History
| Date | Buyer | Sale Price | Title Company |
|---|---|---|---|
| Dansie Jed Elmer | -- | Titleone Twin Falls | |
| Dansie Jed | -- | Title One Twin Falls | |
| Dansie Jed | -- | -- |
Source: Public Records
Mortgage History
| Date | Status | Borrower | Loan Amount |
|---|---|---|---|
| Open | Dansie Jed Elmer | $300,500 | |
| Closed | Dansie Jed | $300,000 |
Source: Public Records
Tax History Compared to Growth
Tax History
| Year | Tax Paid | Tax Assessment Tax Assessment Total Assessment is a certain percentage of the fair market value that is determined by local assessors to be the total taxable value of land and additions on the property. | Land | Improvement |
|---|---|---|---|---|
| 2024 | $3,137 | $725,355 | $167,885 | $557,470 |
| 2023 | $2,641 | $692,235 | $167,885 | $524,350 |
| 2022 | $3,181 | $614,175 | $144,115 | $470,060 |
| 2021 | $2,576 | $443,744 | $82,864 | $360,880 |
| 2020 | $2,435 | $388,692 | $79,752 | $308,940 |
| 2019 | $2,442 | $368,642 | $0 | $0 |
| 2018 | $2,385 | $352,772 | $73,792 | $278,980 |
| 2017 | $2,142 | $332,642 | $53,662 | $278,980 |
| 2016 | $2,123 | $94,745 | $0 | $0 |
| 2015 | -- | $0 | $0 | $0 |
| 2014 | -- | $0 | $0 | $0 |
| 2012 | -- | $0 | $0 | $0 |
Source: Public Records
Map
Nearby Homes