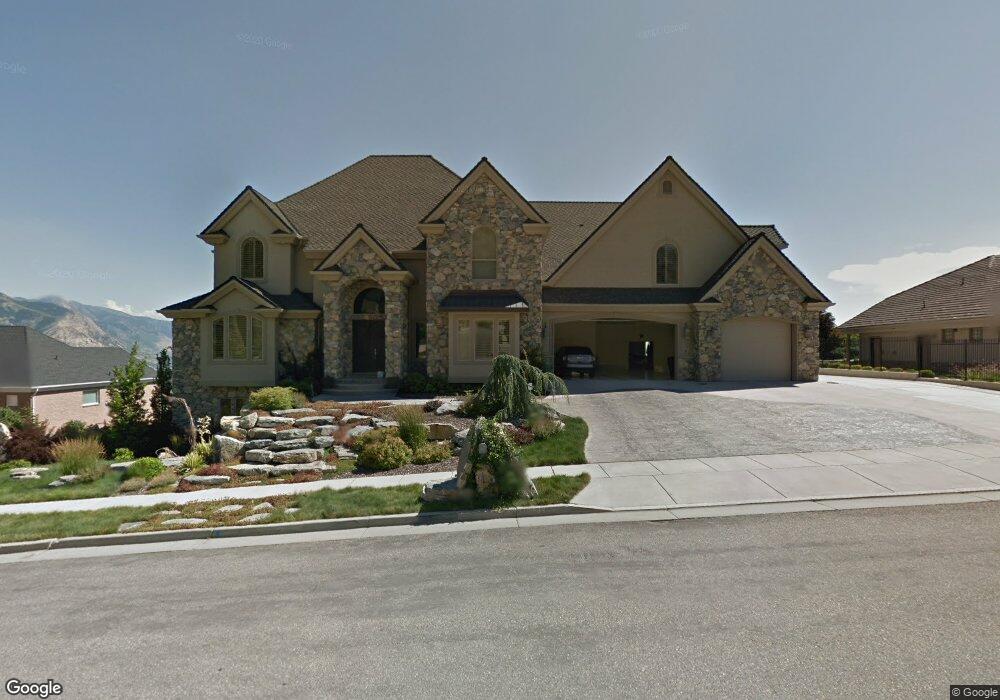
179 W 4100 N Unit 29 Pleasant View, UT 84414
Estimated Value: $932,000 - $2,101,000
5
Beds
5
Baths
7,644
Sq Ft
$197/Sq Ft
Est. Value
About This Home
This home is located at 179 W 4100 N Unit 29, Pleasant View, UT 84414 and is currently estimated at $1,508,859, approximately $197 per square foot. 179 W 4100 N Unit 29 is a home located in Weber County with nearby schools including Lomond View School, Orion Junior High School, and Weber High School.
Ownership History
Date
Name
Owned For
Owner Type
Purchase Details
Closed on
Jan 17, 2007
Sold by
Butters Craig
Bought by
Butters Craig R and Butters Lori L
Current Estimated Value
Home Financials for this Owner
Home Financials are based on the most recent Mortgage that was taken out on this home.
Original Mortgage
$250,000
Outstanding Balance
$148,399
Interest Rate
6.09%
Mortgage Type
New Conventional
Estimated Equity
$1,360,460
Purchase Details
Closed on
Nov 14, 2002
Sold by
Marshall Gilley A
Bought by
Butters Craig
Purchase Details
Closed on
Aug 31, 2000
Sold by
Weber View Properties Lc
Bought by
Marshall Gilly A
Create a Home Valuation Report for This Property
The Home Valuation Report is an in-depth analysis detailing your home's value as well as a comparison with similar homes in the area
Home Values in the Area
Average Home Value in this Area
Purchase History
| Date | Buyer | Sale Price | Title Company |
|---|---|---|---|
| Butters Craig R | -- | Intermountain Title | |
| Butters Craig | -- | Associated Title | |
| Marshall Gilly A | -- | U S Title |
Source: Public Records
Mortgage History
| Date | Status | Borrower | Loan Amount |
|---|---|---|---|
| Open | Butters Craig R | $250,000 |
Source: Public Records
Tax History Compared to Growth
Tax History
| Year | Tax Paid | Tax Assessment Tax Assessment Total Assessment is a certain percentage of the fair market value that is determined by local assessors to be the total taxable value of land and additions on the property. | Land | Improvement |
|---|---|---|---|---|
| 2025 | $7,555 | $1,191,588 | $306,486 | $885,102 |
| 2024 | $7,320 | $643,499 | $168,567 | $474,932 |
| 2023 | $9,292 | $836,000 | $167,726 | $668,274 |
| 2022 | $9,823 | $907,137 | $157,340 | $749,797 |
| 2021 | $8,318 | $1,297,566 | $147,468 | $1,150,098 |
| 2020 | $7,305 | $1,047,718 | $127,560 | $920,158 |
| 2019 | $6,966 | $952,000 | $121,303 | $830,697 |
| 2018 | $8,771 | $1,203,000 | $121,303 | $1,081,697 |
| 2017 | $6,974 | $1,025,000 | $121,303 | $903,697 |
| 2016 | $8,335 | $590,151 | $56,144 | $534,007 |
| 2015 | $6,869 | $481,276 | $59,508 | $421,768 |
| 2014 | $6,975 | $481,275 | $59,508 | $421,767 |
Source: Public Records
Map
Nearby Homes