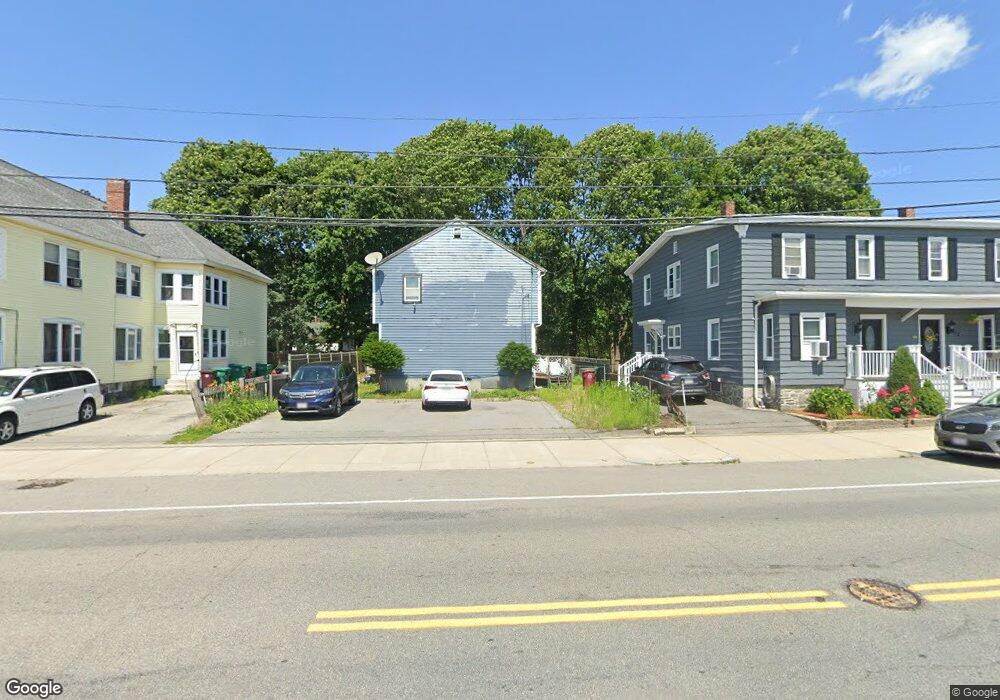
179 W 6th St Lowell, MA 01850
Centralville NeighborhoodEstimated Value: $598,000 - $694,599
6
Beds
4
Baths
2,338
Sq Ft
$275/Sq Ft
Est. Value
About This Home
This home is located at 179 W 6th St, Lowell, MA 01850 and is currently estimated at $642,150, approximately $274 per square foot. 179 W 6th St is a home located in Middlesex County with nearby schools including Greenhalge Elementary School, S. Christa McAuliffe Elementary School, and Moody Elementary School.
Ownership History
Date
Name
Owned For
Owner Type
Purchase Details
Closed on
Aug 31, 1998
Sold by
Chascin Gary and Landry Donald J
Bought by
Sem Sokhom and Hout Kim H
Current Estimated Value
Home Financials for this Owner
Home Financials are based on the most recent Mortgage that was taken out on this home.
Original Mortgage
$99,000
Outstanding Balance
$21,148
Interest Rate
6.9%
Mortgage Type
Purchase Money Mortgage
Estimated Equity
$621,002
Purchase Details
Closed on
Dec 8, 1995
Sold by
Phachansiry Souring T
Bought by
Chascin Gary and Landry Donald J
Home Financials for this Owner
Home Financials are based on the most recent Mortgage that was taken out on this home.
Original Mortgage
$32,000
Interest Rate
7.44%
Mortgage Type
Purchase Money Mortgage
Create a Home Valuation Report for This Property
The Home Valuation Report is an in-depth analysis detailing your home's value as well as a comparison with similar homes in the area
Home Values in the Area
Average Home Value in this Area
Purchase History
| Date | Buyer | Sale Price | Title Company |
|---|---|---|---|
| Sem Sokhom | $110,000 | -- | |
| Sem Sokhom | $110,000 | -- | |
| Chascin Gary | $58,000 | -- | |
| Chascin Gary | $58,000 | -- |
Source: Public Records
Mortgage History
| Date | Status | Borrower | Loan Amount |
|---|---|---|---|
| Open | Chascin Gary | $99,000 | |
| Closed | Chascin Gary | $99,000 | |
| Previous Owner | Chascin Gary | $32,000 |
Source: Public Records
Tax History Compared to Growth
Tax History
| Year | Tax Paid | Tax Assessment Tax Assessment Total Assessment is a certain percentage of the fair market value that is determined by local assessors to be the total taxable value of land and additions on the property. | Land | Improvement |
|---|---|---|---|---|
| 2025 | $6,839 | $595,700 | $134,500 | $461,200 |
| 2024 | $6,286 | $527,800 | $133,600 | $394,200 |
| 2023 | $5,996 | $482,800 | $116,200 | $366,600 |
| 2022 | $5,367 | $422,900 | $105,600 | $317,300 |
| 2021 | $5,126 | $380,800 | $91,900 | $288,900 |
| 2020 | $4,544 | $340,100 | $75,500 | $264,600 |
| 2019 | $4,167 | $296,800 | $60,600 | $236,200 |
| 2018 | $3,934 | $273,400 | $57,700 | $215,700 |
| 2017 | $3,881 | $260,100 | $45,200 | $214,900 |
| 2016 | $3,837 | $253,100 | $48,600 | $204,500 |
| 2015 | $3,598 | $232,400 | $48,600 | $183,800 |
| 2013 | $3,508 | $233,700 | $65,000 | $168,700 |
Source: Public Records
Map
Nearby Homes