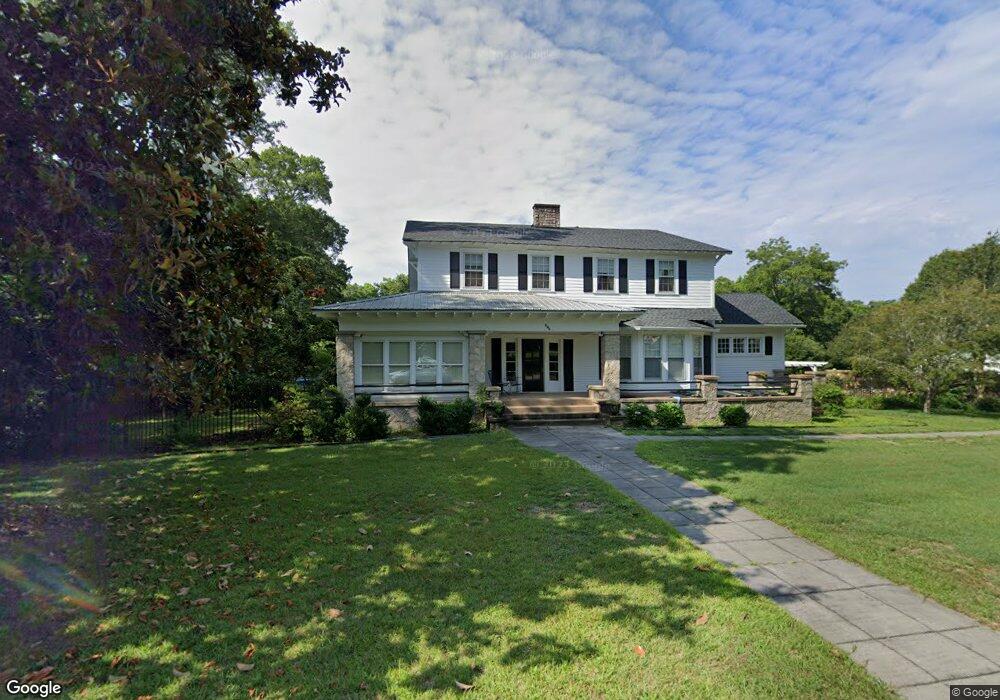
179 W Main St Rutledge, GA 30663
Estimated Value: $119,977 - $191,000
2
Beds
1
Bath
861
Sq Ft
$182/Sq Ft
Est. Value
About This Home
This home is located at 179 W Main St, Rutledge, GA 30663 and is currently estimated at $156,494, approximately $181 per square foot. 179 W Main St is a home located in Morgan County with nearby schools including Morgan County Primary School, Morgan County Elementary School, and Morgan County Middle School.
Ownership History
Date
Name
Owned For
Owner Type
Purchase Details
Closed on
Jul 30, 2024
Sold by
Elevate 2 Self Storage Llc
Bought by
Kroll Jeffrey and Kroll Kristy
Current Estimated Value
Purchase Details
Closed on
Oct 12, 2023
Sold by
Elgen Homes Inc
Bought by
Elevate 2 Self Storage Llc
Purchase Details
Closed on
Nov 1, 2018
Sold by
Foy John H
Bought by
Elgen Homes Inc
Purchase Details
Closed on
Aug 27, 2014
Sold by
Medford June Riddle
Bought by
Foy John H and Foy Michell M
Purchase Details
Closed on
Apr 25, 1989
Sold by
Sentry Insurance
Bought by
Medford Larry P
Create a Home Valuation Report for This Property
The Home Valuation Report is an in-depth analysis detailing your home's value as well as a comparison with similar homes in the area
Home Values in the Area
Average Home Value in this Area
Purchase History
| Date | Buyer | Sale Price | Title Company |
|---|---|---|---|
| Kroll Jeffrey | $125,000 | -- | |
| Elevate 2 Self Storage Llc | $250,000 | -- | |
| Elgen Homes Inc | $89,900 | -- | |
| Foy John H | $60,000 | -- | |
| Medford Larry P | $15,000 | -- |
Source: Public Records
Tax History
| Year | Tax Paid | Tax Assessment Tax Assessment Total Assessment is a certain percentage of the fair market value that is determined by local assessors to be the total taxable value of land and additions on the property. | Land | Improvement |
|---|---|---|---|---|
| 2025 | $405 | $15,940 | $15,200 | $740 |
| 2024 | $1,166 | $45,206 | $15,200 | $30,006 |
| 2023 | $953 | $35,824 | $13,600 | $22,224 |
| 2022 | $952 | $34,424 | $13,600 | $20,824 |
| 2021 | $773 | $27,820 | $8,000 | $19,820 |
| 2020 | $724 | $25,820 | $6,000 | $19,820 |
| 2019 | $1,024 | $42,126 | $8,000 | $34,126 |
| 2018 | $991 | $34,294 | $8,000 | $26,294 |
| 2017 | $925 | $31,578 | $8,000 | $23,578 |
| 2016 | $884 | $29,371 | $8,000 | $21,371 |
| 2015 | $733 | $29,801 | $8,000 | $21,801 |
| 2014 | $812 | $27,237 | $8,000 | $19,237 |
| 2013 | -- | $23,760 | $8,000 | $15,760 |
Source: Public Records
Map
Nearby Homes
- 120 Hidden Falls Ct
- 224 Hollis St
- 170 Fairplay St
- 120 Springs Creek Dr
- 0 Hawkins Academy Rd Unit 10561655
- 5761 W Dixie Hwy
- 5521 Atlanta Hwy
- 1281 Chilton Woods Rd
- 0 W Dixie Hwy Unit 10499573
- 1041 Cooper Ln
- 1150 Harris Hollis Ln
- 1000 Amber Stapp Studdard Rd
- 3195 Davis Academy Rd
- 3641 Davis Academy Rd
- 1760 Fears Rd
- 25 Browning Shoals Rd
- 2535B Willow Grove Ln
- 725 Amber Lakes Ct
- 4923 Hawkins Academy Rd
- 00 Fears Rd
- 179 W Main St
- 189 W Main St
- 161 W Main St
- 195 W Main St
- 188 W Main St Unit LOT 2
- 188 W Main St
- 201 W Main St
- 209 W Dixie Hwy
- 194 W Main St Unit PLUS OFF-LAKE LOT
- 194 W Main St
- 195 W Dixie Hwy
- 144 W Main St
- 170 W Main St
- 183 W Dixie Hwy Unit A/B
- 183 W Dixie Hwy
- 164 W Main St
- 202 W Main St
- 202 W Main St Unit 202
- 209 W Main St
- 145 W Main St
Your Personal Tour Guide
Ask me questions while you tour the home.