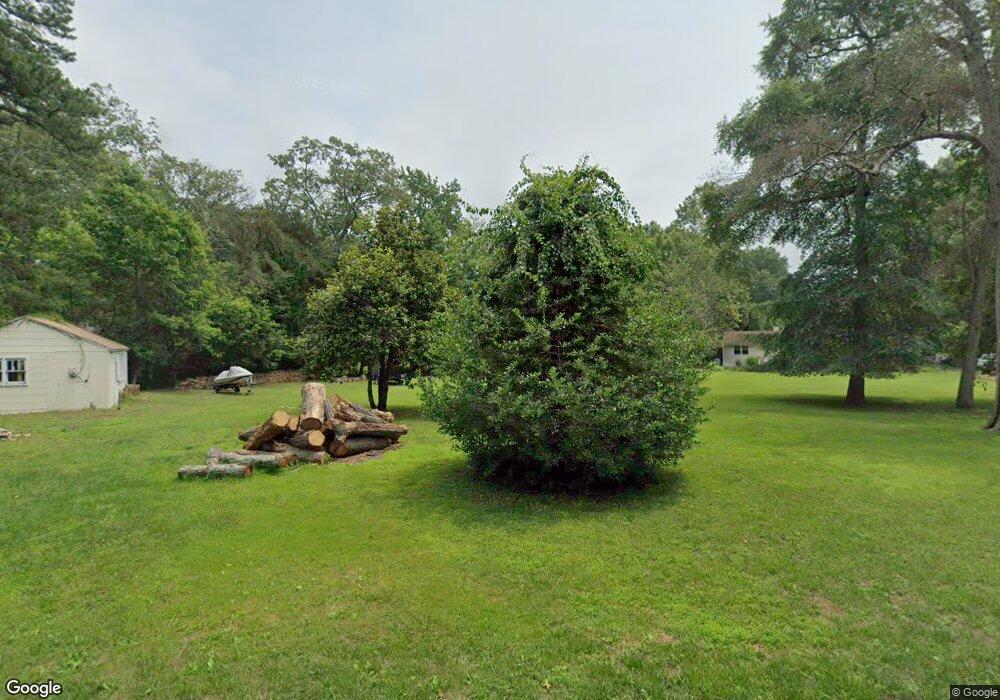
179 Waldo Rd Pasadena, MD 21122
Estimated Value: $544,000 - $616,000
Studio
3
Baths
2,367
Sq Ft
$242/Sq Ft
Est. Value
About This Home
This home is located at 179 Waldo Rd, Pasadena, MD 21122 and is currently estimated at $572,771, approximately $241 per square foot. 179 Waldo Rd is a home located in Anne Arundel County with nearby schools including Lake Shore Elementary School, Chesapeake Bay Middle School, and Chesapeake High School.
Ownership History
Date
Name
Owned For
Owner Type
Purchase Details
Closed on
Jul 30, 2004
Sold by
Adams Duncan L
Bought by
Beatty Christopher A and Beatty Susan A
Current Estimated Value
Purchase Details
Closed on
Feb 27, 1987
Sold by
Kiessling Trevor A
Bought by
Adams 3Rd Duncan L
Home Financials for this Owner
Home Financials are based on the most recent Mortgage that was taken out on this home.
Original Mortgage
$122,250
Interest Rate
9.07%
Create a Home Valuation Report for This Property
The Home Valuation Report is an in-depth analysis detailing your home's value as well as a comparison with similar homes in the area
Home Values in the Area
Average Home Value in this Area
Purchase History
| Date | Buyer | Sale Price | Title Company |
|---|---|---|---|
| Beatty Christopher A | $329,000 | -- | |
| Adams 3Rd Duncan L | $118,200 | -- |
Source: Public Records
Mortgage History
| Date | Status | Borrower | Loan Amount |
|---|---|---|---|
| Previous Owner | Adams 3Rd Duncan L | $122,250 | |
| Closed | Beatty Christopher A | -- |
Source: Public Records
Tax History
| Year | Tax Paid | Tax Assessment Tax Assessment Total Assessment is a certain percentage of the fair market value that is determined by local assessors to be the total taxable value of land and additions on the property. | Land | Improvement |
|---|---|---|---|---|
| 2025 | $4,217 | $415,600 | -- | -- |
| 2024 | $4,217 | $391,900 | $190,000 | $201,900 |
| 2023 | $4,105 | $382,533 | $0 | $0 |
| 2022 | $3,842 | $373,167 | $0 | $0 |
| 2020 | $3,678 | $363,800 | $170,000 | $193,800 |
| 2019 | $3,625 | $363,800 | $170,000 | $193,800 |
| 2018 | $3,826 | $377,300 | $195,000 | $182,300 |
| 2017 | $3,426 | $356,700 | $0 | $0 |
| 2016 | -- | $336,100 | $0 | $0 |
| 2015 | -- | $315,500 | $0 | $0 |
| 2014 | -- | $315,067 | $0 | $0 |
Source: Public Records
Map
Nearby Homes
- 301 Sturtons Ln
- 94 Pine Rd
- 828A Swift Rd
- 333 Sturtons Ln
- 308 Cockey Dr
- 189 10th St
- 325 Beach Ave
- 201 Southwood Rd
- 342 Beach Ave
- 352 Riverside Dr
- 394 North Dr
- 229 Beachwood Rd
- 720 Bridge Dr
- 303 North Dr
- 509 Norwich Rd
- 455 Community Rd
- 336 Magothy Bridge Rd
- 8407 Bodkin Ave
- 296 Berkeley Dr
- 360 Magothy Rd Unit 8H
Your Personal Tour Guide
Ask me questions while you tour the home.