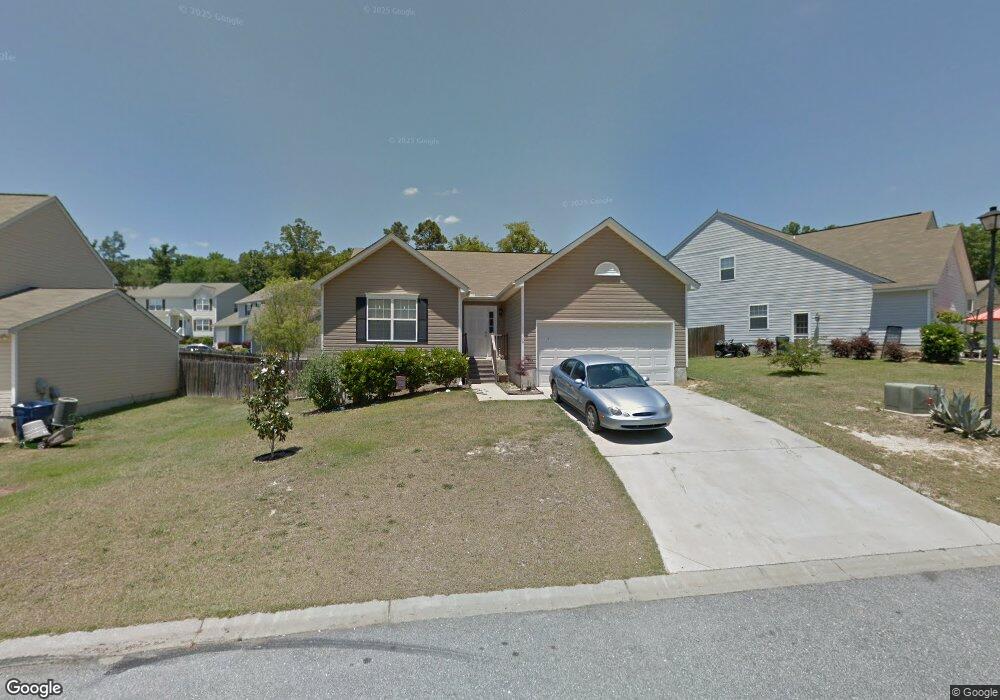
179 Walkbridge Way Chapin, SC 29036
Estimated Value: $229,000 - $258,000
3
Beds
2
Baths
1,483
Sq Ft
$161/Sq Ft
Est. Value
About This Home
This home is located at 179 Walkbridge Way, Chapin, SC 29036 and is currently estimated at $238,648, approximately $160 per square foot. 179 Walkbridge Way is a home located in Lexington County with nearby schools including Chapin Elementary School, Chapin Intermediate, and Chapin High School.
Ownership History
Date
Name
Owned For
Owner Type
Purchase Details
Closed on
Nov 1, 2019
Sold by
Taylor Jon Wade
Bought by
Taylor Jon Wade and Taylor Aleisha
Current Estimated Value
Purchase Details
Closed on
Jul 13, 2017
Sold by
Wells Fargo Bank Na
Bought by
Taylor Joa Wade
Purchase Details
Closed on
Mar 29, 2017
Sold by
Wells Fargo Bank
Bought by
Garner John E and Garner Marsha D
Purchase Details
Closed on
Jun 30, 2008
Sold by
Nvr Rymarc Homes Of South Carolina Llc
Bought by
Garner John E and Lindler Marsha
Home Financials for this Owner
Home Financials are based on the most recent Mortgage that was taken out on this home.
Original Mortgage
$126,773
Interest Rate
6.08%
Mortgage Type
FHA
Purchase Details
Closed on
Mar 10, 2008
Sold by
Five Star Development Llc
Bought by
Nvr Rymarc Homes Of South Carolina Llc
Create a Home Valuation Report for This Property
The Home Valuation Report is an in-depth analysis detailing your home's value as well as a comparison with similar homes in the area
Home Values in the Area
Average Home Value in this Area
Purchase History
| Date | Buyer | Sale Price | Title Company |
|---|---|---|---|
| Taylor Jon Wade | -- | None Available | |
| Taylor Joa Wade | $82,500 | None Available | |
| Garner John E | -- | None Available | |
| Garner John E | $127,775 | -- | |
| Nvr Rymarc Homes Of South Carolina Llc | $41,000 | None Available |
Source: Public Records
Mortgage History
| Date | Status | Borrower | Loan Amount |
|---|---|---|---|
| Previous Owner | Garner John E | $126,773 |
Source: Public Records
Tax History Compared to Growth
Tax History
| Year | Tax Paid | Tax Assessment Tax Assessment Total Assessment is a certain percentage of the fair market value that is determined by local assessors to be the total taxable value of land and additions on the property. | Land | Improvement |
|---|---|---|---|---|
| 2024 | $920 | $5,584 | $982 | $4,602 |
| 2023 | $854 | $5,584 | $982 | $4,602 |
| 2020 | $902 | $5,584 | $982 | $4,602 |
| 2019 | $799 | $7,284 | $1,200 | $6,084 |
| 2018 | $3,007 | $7,284 | $1,200 | $6,084 |
| 2017 | $686 | $4,856 | $800 | $4,056 |
| 2016 | $703 | $4,855 | $800 | $4,055 |
| 2014 | $749 | $5,203 | $800 | $4,403 |
| 2013 | -- | $5,200 | $800 | $4,400 |
Source: Public Records
Map
Nearby Homes
- 0 Dreher Island Rd Unit 21647709
- 0 Dreher Island Rd Unit 587193
- 100 Palm St
- 117 Bay Front Dr
- 510 Lilypad Ct
- 171 Elm Creek Dr
- 125 Northshore Dr
- 129 Monroe Preserve Dr
- 108 Pennsylvania Ct
- 412 Northshore Ct
- 417 Northshore Ct
- 0 Mainsail Ln Unit 622256
- 147 Ventnor Ave
- 3006 Chilmark Rd
- 100 Baltic Ct
- 814 Dutchmaster Dr
- 1431 Saugus Ct
- 409 Dutchman Shores Cir
- 908 Old Lexington Hwy
- 161 Dutchman Shores Cir
- 191 Walkbridge Way
- 6 Walkbridge Ct
- 207 Walkbridge Way
- 170 Walkbridge Way
- 178 Walkbridge Way
- 10 Walkbridge Ct
- 215 Walkbridge Way
- 182 Walkbridge Way
- 166 Walkbridge Way
- 186 Walkbridge Way
- 190 Walkbridge Way
- 162 Walkbridge Way
- 1 Walkbridge Ct
- 14 Walkbridge Ct
- 194 Walkbridge Way
- 5 Walkbridge Ct
- 158 Walkbridge Way
- 13 Walkbridge Ct
- 198 Walkbridge Way
- 204 Walkbridge Way