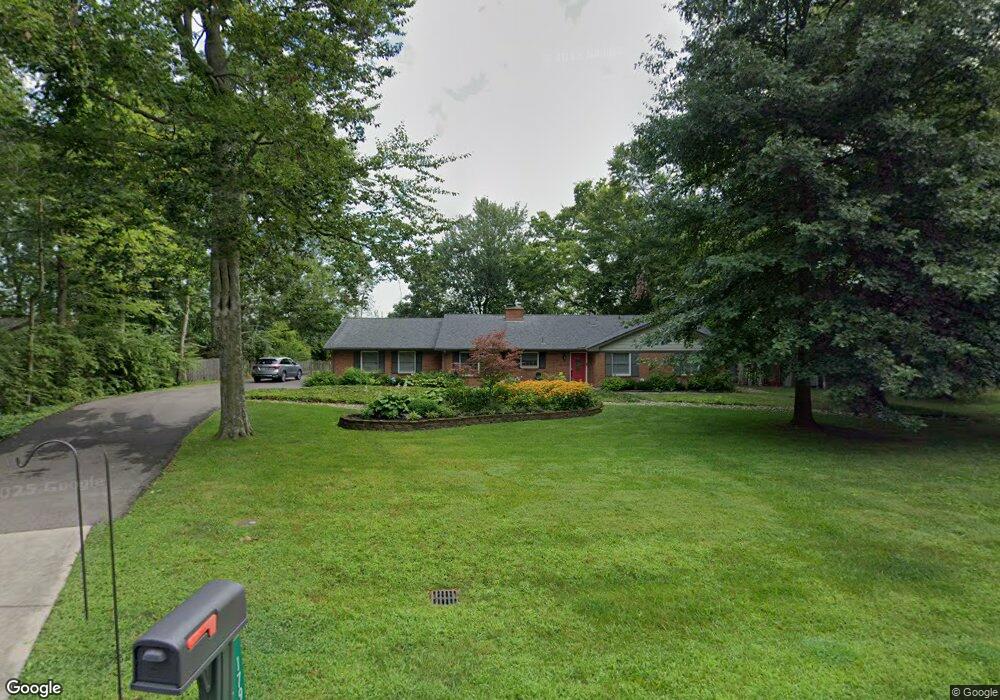
179 Webbshaw Dr Dayton, OH 45458
Estimated Value: $326,000 - $355,000
3
Beds
2
Baths
1,820
Sq Ft
$188/Sq Ft
Est. Value
About This Home
This home is located at 179 Webbshaw Dr, Dayton, OH 45458 and is currently estimated at $341,885, approximately $187 per square foot. 179 Webbshaw Dr is a home located in Montgomery County with nearby schools including Primary Village South, Weller Elementary School, and Magsig Middle School.
Ownership History
Date
Name
Owned For
Owner Type
Purchase Details
Closed on
Apr 23, 2024
Sold by
Trimble Douglas N and Trimble Nancy L
Bought by
Thompson Masako and Thompson Randall R
Current Estimated Value
Home Financials for this Owner
Home Financials are based on the most recent Mortgage that was taken out on this home.
Original Mortgage
$260,000
Outstanding Balance
$255,311
Interest Rate
6.79%
Mortgage Type
New Conventional
Estimated Equity
$86,574
Purchase Details
Closed on
Jul 12, 2019
Sold by
First Donna and Freyvogel John
Bought by
Trimble Douglas N and Trimble Nancy L
Purchase Details
Closed on
Nov 4, 2005
Sold by
Lord Peter and Lord Jane
Bought by
Freyvogel Jon and First Donna
Home Financials for this Owner
Home Financials are based on the most recent Mortgage that was taken out on this home.
Original Mortgage
$16,990
Interest Rate
6.04%
Mortgage Type
Stand Alone Second
Create a Home Valuation Report for This Property
The Home Valuation Report is an in-depth analysis detailing your home's value as well as a comparison with similar homes in the area
Purchase History
| Date | Buyer | Sale Price | Title Company |
|---|---|---|---|
| Thompson Masako | $350,000 | None Listed On Document | |
| Trimble Douglas N | $215,700 | Republic Title Agency Inc | |
| Freyvogel Jon | $169,900 | -- |
Source: Public Records
Mortgage History
| Date | Status | Borrower | Loan Amount |
|---|---|---|---|
| Open | Thompson Masako | $260,000 | |
| Previous Owner | Freyvogel Jon | $16,990 | |
| Previous Owner | Freyvogel Jon | $135,920 |
Source: Public Records
Tax History
| Year | Tax Paid | Tax Assessment Tax Assessment Total Assessment is a certain percentage of the fair market value that is determined by local assessors to be the total taxable value of land and additions on the property. | Land | Improvement |
|---|---|---|---|---|
| 2025 | $6,507 | $87,250 | $14,620 | $72,630 |
| 2024 | $6,032 | $87,250 | $14,620 | $72,630 |
| 2023 | $6,032 | $87,250 | $14,620 | $72,630 |
| 2022 | $6,511 | $75,210 | $12,600 | $62,610 |
| 2021 | $6,528 | $75,210 | $12,600 | $62,610 |
| 2020 | $6,335 | $72,890 | $12,600 | $60,290 |
| 2019 | $4,945 | $49,150 | $12,600 | $36,550 |
| 2018 | $4,486 | $49,150 | $12,600 | $36,550 |
| 2017 | $4,445 | $49,150 | $12,600 | $36,550 |
| 2016 | $4,470 | $46,630 | $12,600 | $34,030 |
| 2015 | $4,409 | $46,630 | $12,600 | $34,030 |
| 2014 | $4,409 | $46,630 | $12,600 | $34,030 |
| 2012 | -- | $52,150 | $12,600 | $39,550 |
Source: Public Records
Map
Nearby Homes
- 9921 Rothschild Ct
- 9905 Rothschild Ct
- 191 Summerford Place
- 1129 Margaux Ct
- 317 Beck Dr
- 1315 Bourdeaux Way
- 536 Hines Cir
- 10312 Tice St
- 10001 Cobble Brook Dr
- 543 Hines Cir
- 9410 Rochelle Ln
- 9417 Rochelle Ln
- 9369 Avingnon Way
- 9197 Remy Ct
- 9333 Rochelle Ln
- 222 E Social Row Rd
- 10957 Shallow Creek Ct
- 9452 Oak Brook Dr
- 9155 Remy Ct
- 1232 Normandy Rue
- 161 Webbshaw Dr
- 199 Webbshaw Dr
- 10964 Bromsgrove Ct
- 198 Webbshaw Dr
- 143 Webbshaw Dr
- 10960 Bromsgrove Ct
- 148 Webbshaw Dr
- 219 Webbshaw Dr
- 127 Webbshaw Dr
- 9925 Hackberry Place
- 9916 Hackberry Place
- 9916 Hackberry Place
- 9916 Hackberry Place
- 126 Webbshaw Dr
- 11033 Mistletoe Ct
- 10956 Bromsgrove Ct
- 11051 Mistletoe Ct
- 9917 Hackberry Place
- 112 Webbshaw Dr
- 10979 Ruston Glen Ct
Your Personal Tour Guide
Ask me questions while you tour the home.