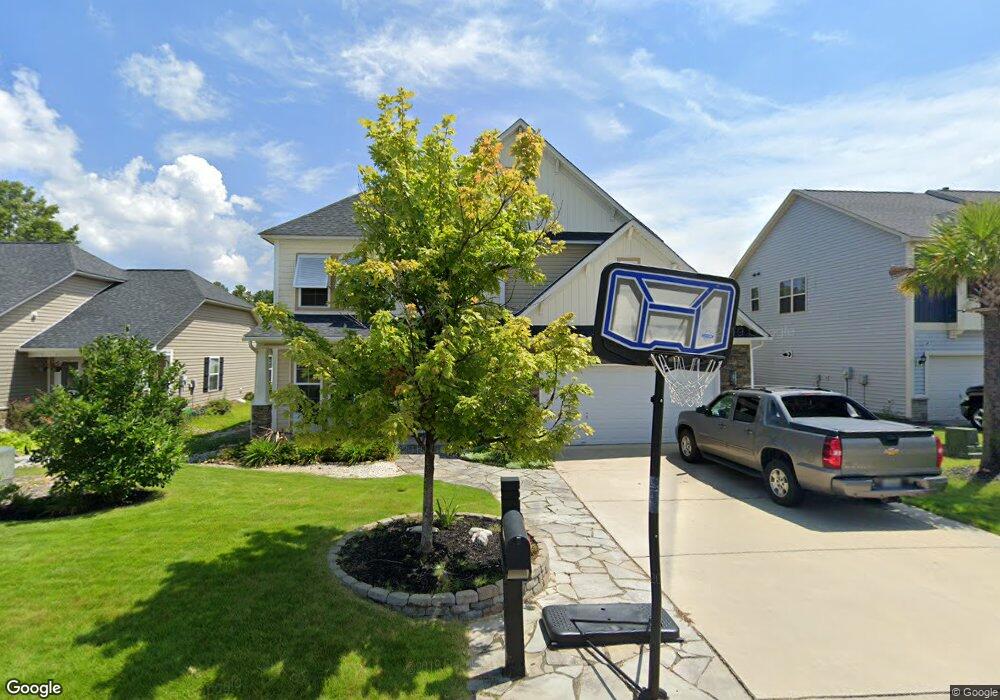
179 Wingspan Way Chapin, SC 29036
Estimated Value: $297,465 - $323,000
4
Beds
3
Baths
2,331
Sq Ft
$133/Sq Ft
Est. Value
About This Home
This home is located at 179 Wingspan Way, Chapin, SC 29036 and is currently estimated at $310,616, approximately $133 per square foot. 179 Wingspan Way is a home located in Lexington County with nearby schools including Chapin Elementary School, Chapin Intermediate, and Chapin High School.
Ownership History
Date
Name
Owned For
Owner Type
Purchase Details
Closed on
May 31, 2016
Sold by
Detches Patrick A and Brenner Genevieve L
Bought by
Cochran Richard and Cochran Alyssa
Current Estimated Value
Purchase Details
Closed on
Nov 20, 2013
Sold by
Detches Patrick A and Brenner Genevieve L
Bought by
Detches Gunthar Travis
Purchase Details
Closed on
Mar 21, 2012
Sold by
Mungo Homes Inc
Bought by
Detches Patrick A and Brenner Genevieve L
Home Financials for this Owner
Home Financials are based on the most recent Mortgage that was taken out on this home.
Original Mortgage
$127,172
Interest Rate
3.89%
Mortgage Type
Future Advance Clause Open End Mortgage
Purchase Details
Closed on
Jan 24, 2011
Sold by
Chapin New Town Llc
Bought by
Mungo Homes Inc
Home Financials for this Owner
Home Financials are based on the most recent Mortgage that was taken out on this home.
Original Mortgage
$35,000,000
Interest Rate
4.58%
Mortgage Type
New Conventional
Create a Home Valuation Report for This Property
The Home Valuation Report is an in-depth analysis detailing your home's value as well as a comparison with similar homes in the area
Home Values in the Area
Average Home Value in this Area
Purchase History
| Date | Buyer | Sale Price | Title Company |
|---|---|---|---|
| Cochran Richard | -- | None Available | |
| Cochran Richard | $204,900 | None Available | |
| Detches Gunthar Travis | -- | -- | |
| Detches Patrick A | $159,747 | -- | |
| Mungo Homes Inc | $705,000 | -- |
Source: Public Records
Mortgage History
| Date | Status | Borrower | Loan Amount |
|---|---|---|---|
| Previous Owner | Detches Patrick A | $127,172 | |
| Previous Owner | Mungo Homes Inc | $35,000,000 |
Source: Public Records
Tax History Compared to Growth
Tax History
| Year | Tax Paid | Tax Assessment Tax Assessment Total Assessment is a certain percentage of the fair market value that is determined by local assessors to be the total taxable value of land and additions on the property. | Land | Improvement |
|---|---|---|---|---|
| 2024 | $1,310 | $7,943 | $1,000 | $6,943 |
| 2023 | $1,215 | $7,943 | $1,000 | $6,943 |
| 2022 | $844 | $7,943 | $1,000 | $6,943 |
| 2020 | $889 | $7,943 | $1,000 | $6,943 |
| 2019 | $880 | $7,780 | $1,000 | $6,780 |
| 2018 | $768 | $7,780 | $1,000 | $6,780 |
| 2017 | $744 | $7,780 | $1,000 | $6,780 |
| 2016 | $530 | $6,106 | $1,000 | $5,106 |
| 2015 | $571 | $6,106 | $1,000 | $5,106 |
| 2014 | $571 | $6,389 | $1,000 | $5,389 |
| 2013 | -- | $6,390 | $1,000 | $5,390 |
Source: Public Records
Map
Nearby Homes
- 814 Dutchmaster Dr
- 1431 Saugus Ct
- 147 Stuck's Point
- 720 Topline St
- 153 Rushton Dr
- 1533 Saugus Ct
- 366 Gallery Cliff Dr
- 228 Bickley View Ct
- 668 Clipper Trail
- 660 Clipper Trail
- 117 Bay Front Dr
- 368 Frick Ct
- 510 Lilypad Ct
- 634 Basalt Ct
- 373 Chapin Place Way
- 339 Newberg Rd
- 342 Chapin Place Way
- 100 Palm St
- 129 Monroe Preserve Dr
- 444 Dolomite Ct
- 177 Wingspan Way
- 175 Wingspan Way
- 265 Eagle Pointe Dr
- 253 Eagle Pointe Dr
- 301 Eagle Pointe Dr
- 180 Wingspan Way
- 180 Wingspan Way
- 176 Wingspan Way
- 178 Wingspan Way
- 305 Eagle Pointe Dr
- 173 Wingspan Way
- 248 Eagle Pointe Dr
- 170 Wingspan Way
- 250 Eagle Pointe Dr
- 309 Eagle Pointe Dr
- 246 Eagle Pointe Dr
- 252 Eagle Pointe Dr
- 244 Eagle Pointe Dr
- 254 Eagle Pointe Dr
- 171 Wingspan Way