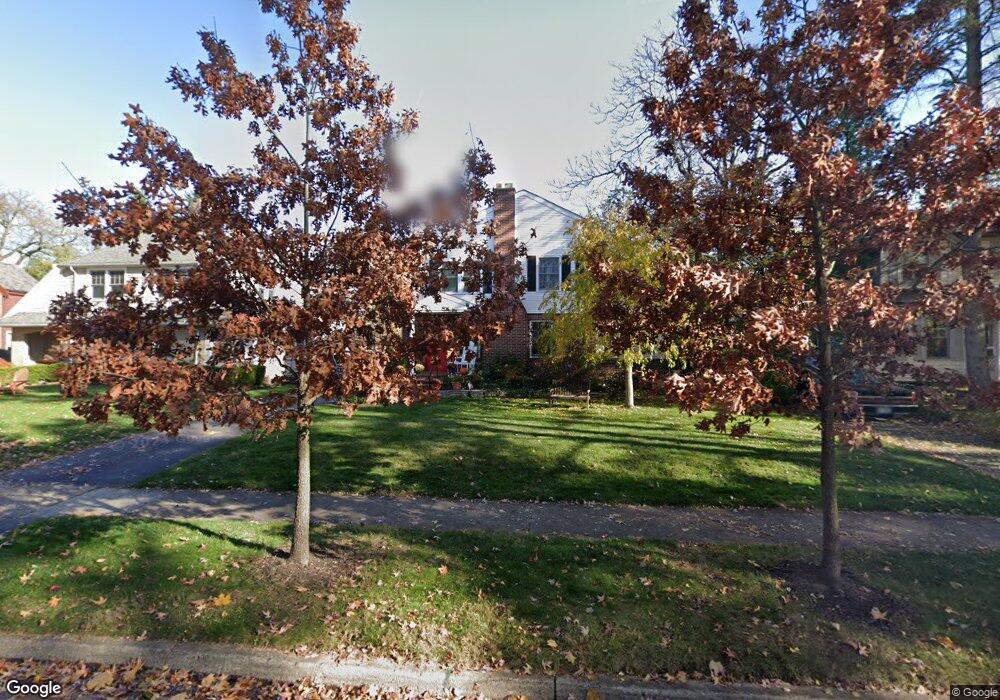
1790 Bedford Rd Columbus, OH 43212
Estimated Value: $783,000 - $912,000
4
Beds
3
Baths
2,557
Sq Ft
$342/Sq Ft
Est. Value
About This Home
This home is located at 1790 Bedford Rd, Columbus, OH 43212 and is currently estimated at $874,696, approximately $342 per square foot. 1790 Bedford Rd is a home located in Franklin County with nearby schools including Barrington Road Elementary School, Jones Middle School, and Upper Arlington High School.
Ownership History
Date
Name
Owned For
Owner Type
Purchase Details
Closed on
Jun 12, 2019
Sold by
Boyd Robert E and Boyd Brenda J
Bought by
Boyd Brenda J and Boyd Robert E
Current Estimated Value
Purchase Details
Closed on
Oct 24, 2012
Sold by
Boyd Brenda J and Boyd Robert E
Bought by
Boyd Brenda J and Boyd Robert E
Home Financials for this Owner
Home Financials are based on the most recent Mortgage that was taken out on this home.
Original Mortgage
$369,000
Outstanding Balance
$252,778
Interest Rate
3.51%
Mortgage Type
New Conventional
Estimated Equity
$621,918
Purchase Details
Closed on
Sep 19, 2006
Sold by
Boyd Brenda J and Boyd Robert E
Bought by
Boyd Robert E and Boyd Brenda J
Home Financials for this Owner
Home Financials are based on the most recent Mortgage that was taken out on this home.
Original Mortgage
$50,000
Interest Rate
6.27%
Mortgage Type
New Conventional
Purchase Details
Closed on
Jun 1, 1985
Purchase Details
Closed on
Mar 1, 1980
Create a Home Valuation Report for This Property
The Home Valuation Report is an in-depth analysis detailing your home's value as well as a comparison with similar homes in the area
Home Values in the Area
Average Home Value in this Area
Purchase History
| Date | Buyer | Sale Price | Title Company |
|---|---|---|---|
| Boyd Brenda J | -- | None Available | |
| Boyd Brenda J | -- | None Available | |
| Boyd Robert E | -- | First Amer | |
| -- | $74,900 | -- | |
| -- | $71,900 | -- |
Source: Public Records
Mortgage History
| Date | Status | Borrower | Loan Amount |
|---|---|---|---|
| Open | Boyd Brenda J | $369,000 | |
| Closed | Boyd Robert E | $50,000 |
Source: Public Records
Tax History
| Year | Tax Paid | Tax Assessment Tax Assessment Total Assessment is a certain percentage of the fair market value that is determined by local assessors to be the total taxable value of land and additions on the property. | Land | Improvement |
|---|---|---|---|---|
| 2025 | $14,567 | $251,620 | $115,990 | $135,630 |
| 2024 | $14,567 | $251,620 | $115,990 | $135,630 |
| 2023 | $14,386 | $251,615 | $115,990 | $135,625 |
| 2022 | $12,561 | $179,760 | $64,050 | $115,710 |
| 2021 | $11,119 | $179,760 | $64,050 | $115,710 |
| 2020 | $11,021 | $179,760 | $64,050 | $115,710 |
| 2019 | $11,060 | $159,500 | $64,050 | $95,450 |
| 2018 | $9,633 | $159,500 | $64,050 | $95,450 |
| 2017 | $9,675 | $159,500 | $64,050 | $95,450 |
| 2016 | $8,276 | $123,660 | $49,700 | $73,960 |
| 2015 | $8,268 | $123,660 | $49,700 | $73,960 |
| 2014 | $8,178 | $123,660 | $49,700 | $73,960 |
| 2013 | $3,955 | $112,420 | $45,185 | $67,235 |
Source: Public Records
Map
Nearby Homes
- 1942 Bedford Rd
- 1921 Wyandotte Rd
- 2015 W 5th Ave Unit 211
- 2015 W 5th Ave Unit 102
- 2015 W 5th Ave Unit 108
- 1561 Glenn Ave
- 1951 Glenn Ave
- 1876 Westwood Ave
- 1585 Arlington Ave Unit 1585A
- 1579 Arlington Ave Unit 1579B
- 1631 Roxbury Rd Unit D2
- 1530 Lincoln Rd
- 1523 Wyandotte Rd
- 1654-1656 Ashland Ave
- 1648 Ashland Ave
- 1810 Ashland Ave
- 1780 Waltham Rd
- 1624 Ashland Ave
- 2006 Cambridge Blvd
- 1507 Chesapeake Ave
- 1796 Bedford Rd
- 1784 Bedford Rd
- 1800 Bedford Rd
- 1776 Bedford Rd
- 1773 Andover Rd
- 1781 Andover Rd
- 1765 Andover Rd
- 1785 Andover Rd
- 1812 Bedford Rd
- 1789 Bedford Rd
- 1768 Bedford Rd
- 1795 Bedford Rd
- 1759 Andover Rd
- 1793 Andover Rd
- 1775 Bedford Rd
- 1811 Bedford Rd
- 1803 Andover Rd
- 1753 Andover Rd
- 1760 Bedford Rd
- 1818 Bedford Rd
Your Personal Tour Guide
Ask me questions while you tour the home.