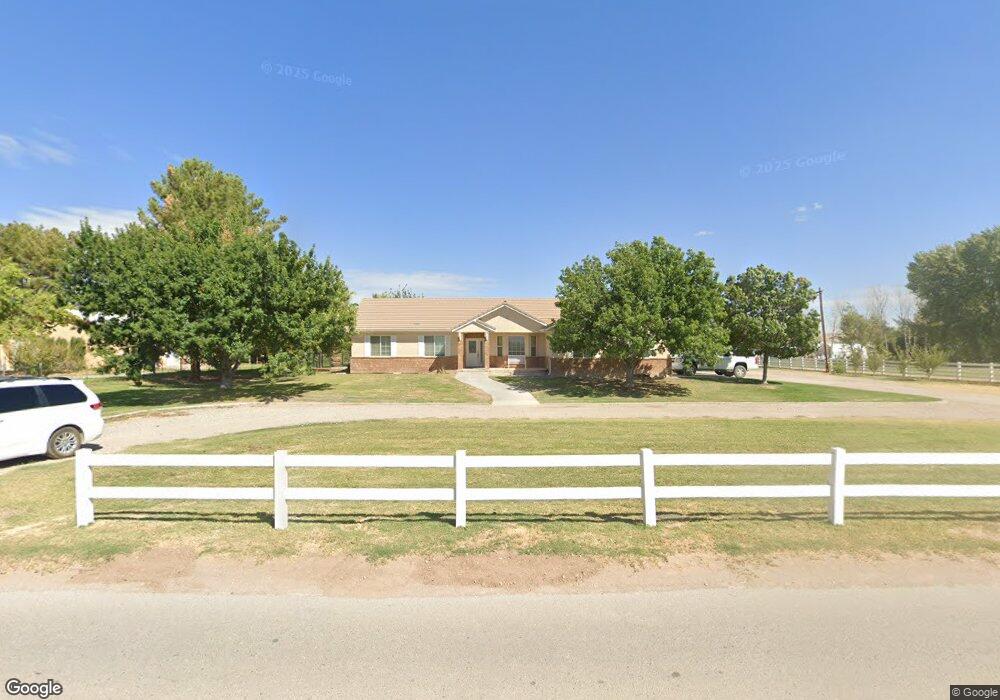
1790 Hardy Ave Logandale, NV 89021
Estimated Value: $541,000 - $784,000
3
Beds
3
Baths
3,691
Sq Ft
$174/Sq Ft
Est. Value
About This Home
This home is located at 1790 Hardy Ave, Logandale, NV 89021 and is currently estimated at $640,612, approximately $173 per square foot. 1790 Hardy Ave is a home with nearby schools including Grant Bowler Elementary School, Mack Lyon Middle School, and Moapa Valley High School.
Ownership History
Date
Name
Owned For
Owner Type
Purchase Details
Closed on
Mar 24, 2009
Sold by
Cameron Bruce G
Bought by
Baldwin Cody and Baldwin Jennifer
Current Estimated Value
Purchase Details
Closed on
Mar 20, 2009
Sold by
Baldwin Cody and Baldwin Jennifer
Bought by
Cameron Bruce G and Cameron Sandra
Purchase Details
Closed on
Aug 25, 2006
Sold by
Marshall Edwin J and Marshall Amy Rae
Bought by
Baldwin Cody and Baldwin Jennifer
Home Financials for this Owner
Home Financials are based on the most recent Mortgage that was taken out on this home.
Original Mortgage
$325,000
Interest Rate
6.76%
Mortgage Type
Seller Take Back
Purchase Details
Closed on
Aug 21, 1998
Sold by
Marshall Lloyd J and Marshall Judith Rae
Bought by
Marshall Edwin J and Marshall Amy Rae
Create a Home Valuation Report for This Property
The Home Valuation Report is an in-depth analysis detailing your home's value as well as a comparison with similar homes in the area
Home Values in the Area
Average Home Value in this Area
Purchase History
| Date | Buyer | Sale Price | Title Company |
|---|---|---|---|
| Baldwin Cody | -- | Silver State Title Company | |
| Cameron Bruce G | $100,000 | Silver State Title Company | |
| Baldwin Cody | $625,000 | Financial Title Company | |
| Marshall Edwin J | $24,500 | Land Title |
Source: Public Records
Mortgage History
| Date | Status | Borrower | Loan Amount |
|---|---|---|---|
| Previous Owner | Baldwin Cody | $325,000 |
Source: Public Records
Tax History Compared to Growth
Tax History
| Year | Tax Paid | Tax Assessment Tax Assessment Total Assessment is a certain percentage of the fair market value that is determined by local assessors to be the total taxable value of land and additions on the property. | Land | Improvement |
|---|---|---|---|---|
| 2025 | $3,326 | $179,880 | $26,525 | $153,355 |
| 2024 | $3,230 | $179,880 | $26,525 | $153,355 |
| 2023 | $3,230 | $165,338 | $21,936 | $143,401 |
| 2022 | $3,137 | $147,647 | $19,075 | $128,572 |
| 2021 | $3,184 | $143,701 | $18,200 | $125,501 |
| 2020 | $2,934 | $142,717 | $18,200 | $124,517 |
| 2019 | $2,750 | $127,338 | $17,500 | $109,838 |
| 2018 | $2,624 | $124,666 | $17,500 | $107,166 |
| 2017 | $3,210 | $127,044 | $17,500 | $109,544 |
| 2016 | $2,478 | $105,911 | $15,750 | $90,161 |
| 2015 | $2,475 | $96,707 | $15,750 | $80,957 |
| 2014 | -- | $91,192 | $15,750 | $75,442 |
Source: Public Records
Map
Nearby Homes
- 3765 Berkeley St
- 3728 River Heights Ln
- 0 Unit 2676698
- 2025 Whipple Ave
- 1593 Valley Home Ct
- 1951 Jim Haworth Ct
- 1990 Liston Ave
- 3811 Skyline St
- 0 Moapa Valley Unit 2721305
- 0 Paiute St
- 4045 River Heights Ln
- 1604 Heights Dr
- 1573 Heights Dr
- 1525 Heights Dr
- 2925 Rice St
- 4135 Sandy St
- 1140 Mahoney Ave
- 1998 Whitneys Dream Ave
- 1141 Thomas Bay Cir
- 0 Skyline St
- 1810 Hardy Ave
- 1750 Hardy Ave
- 1860 Hardy Ave
- 1864 Hardy Ave
- 1868 Hardy Ave
- 1805 Whipple Ave
- 0 Hardy Ave
- 3610 N Moapa Valley Blvd
- 1872 Hardy Ave
- 1650 Hardy Ave
- 1795 Whipple Ave
- 3505 N Moapa Valley Blvd
- 3665 Paiute St
- 1755 Whipple Ave
- 1620 Hardy Ave
- 1735 Whipple Ave
- 3645 N Moapa Valley Blvd
- 3515 Sandy Ln
- 1800 Whipple Ave