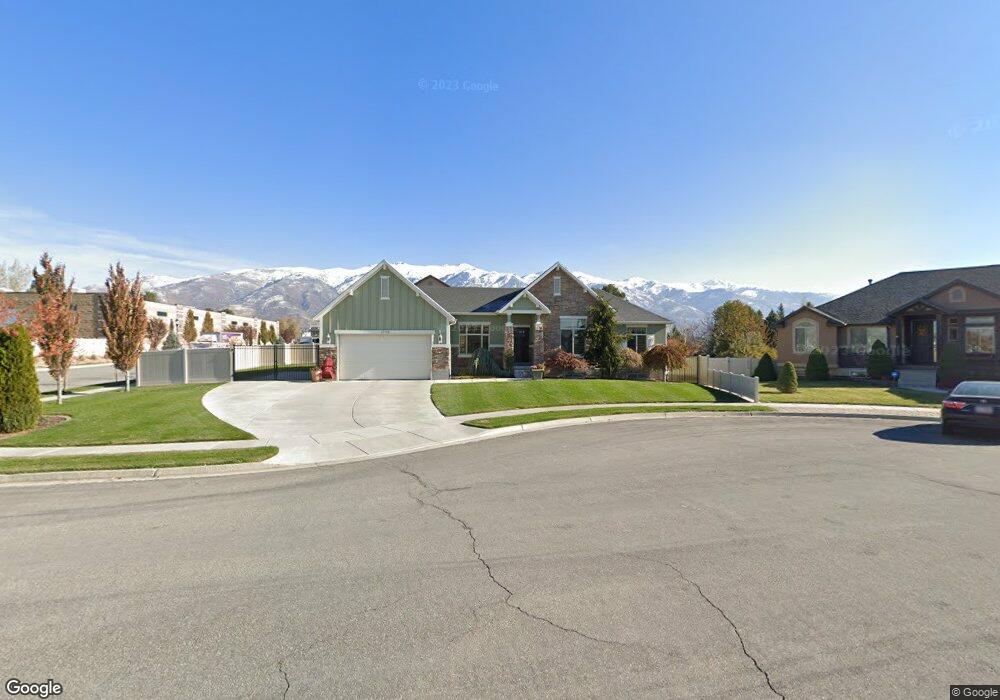
1790 N 275 E Unit 5 Layton, UT 84041
Estimated Value: $588,000 - $690,000
4
Beds
3
Baths
1,590
Sq Ft
$403/Sq Ft
Est. Value
About This Home
This home is located at 1790 N 275 E Unit 5, Layton, UT 84041 and is currently estimated at $641,147, approximately $403 per square foot. 1790 N 275 E Unit 5 is a home located in Davis County with nearby schools including Lincoln Elementary School, North Layton Junior High School, and Northridge High School.
Ownership History
Date
Name
Owned For
Owner Type
Purchase Details
Closed on
Sep 11, 2013
Sold by
Workman Wade W
Bought by
Mcdonald David and Mcdonald Jennifer
Current Estimated Value
Home Financials for this Owner
Home Financials are based on the most recent Mortgage that was taken out on this home.
Original Mortgage
$292,896
Outstanding Balance
$218,769
Interest Rate
4.5%
Mortgage Type
FHA
Estimated Equity
$422,378
Purchase Details
Closed on
Jun 1, 2011
Sold by
Innovative Homes Inc
Bought by
Workman Wade W
Purchase Details
Closed on
Jun 19, 2009
Sold by
Carter Rick A
Bought by
Barnes Banking Company
Purchase Details
Closed on
Nov 6, 2006
Sold by
Heartland Llc
Bought by
Carter Rick A
Home Financials for this Owner
Home Financials are based on the most recent Mortgage that was taken out on this home.
Original Mortgage
$960,000
Interest Rate
6.3%
Mortgage Type
Purchase Money Mortgage
Create a Home Valuation Report for This Property
The Home Valuation Report is an in-depth analysis detailing your home's value as well as a comparison with similar homes in the area
Home Values in the Area
Average Home Value in this Area
Purchase History
| Date | Buyer | Sale Price | Title Company |
|---|---|---|---|
| Mcdonald David | -- | Aspen Title Insurance | |
| Workman Wade W | -- | None Available | |
| Barnes Banking Company | -- | Inwest Title Services Inc | |
| Carter Rick A | -- | Security Title |
Source: Public Records
Mortgage History
| Date | Status | Borrower | Loan Amount |
|---|---|---|---|
| Open | Mcdonald David | $292,896 | |
| Previous Owner | Carter Rick A | $960,000 |
Source: Public Records
Tax History
| Year | Tax Paid | Tax Assessment Tax Assessment Total Assessment is a certain percentage of the fair market value that is determined by local assessors to be the total taxable value of land and additions on the property. | Land | Improvement |
|---|---|---|---|---|
| 2025 | $3,112 | $326,700 | $99,966 | $226,734 |
| 2024 | $2,939 | $310,750 | $116,295 | $194,455 |
| 2023 | $2,962 | $552,000 | $136,544 | $415,456 |
| 2022 | $2,978 | $301,400 | $72,703 | $228,697 |
| 2021 | $2,842 | $429,000 | $103,344 | $325,656 |
| 2020 | $2,686 | $389,000 | $86,382 | $302,618 |
| 2019 | $2,538 | $360,000 | $81,522 | $278,478 |
| 2018 | $2,339 | $333,000 | $81,522 | $251,478 |
| 2016 | $2,158 | $158,511 | $26,417 | $132,094 |
| 2015 | $2,059 | $143,551 | $26,417 | $117,134 |
| 2014 | $2,235 | $159,350 | $26,417 | $132,933 |
| 2013 | -- | $140,362 | $33,088 | $107,274 |
Source: Public Records
Map
Nearby Homes
- 14 W Belvedere Way
- 227 E 1500 N
- 1857 N 50 W
- 1908 N 200 W
- 1571 N 160 W
- 1683 N 250 W
- 103 E 1250 N
- 126 E 1150 N
- 1085 N 125 E
- 2500 N Fort Ln Unit 212
- 2500 N Fort Ln Unit 244
- 2214 N 450 W
- 2234 N 450 W
- 965 Amethyst St
- 1048 E Cherry Ln
- 975 N Garnet St
- 2246 N 475 W
- 2600 N Hill Field Rd Unit 134
- 2600 N Hill Field Rd Unit 4
- 1148 N 350 W
- 1790 N 275 E
- 292 E 1800 N
- 292 E 1800 N Unit 5
- 310 E 1800 N
- 310 E 1800 N Unit 4
- 1778 N 275 E
- 326 E 1800 N
- 326 E 1800 N Unit 3
- 1791 N 275 E Unit 8
- 1791 N 275 E
- 260 E 1800 N
- 260 E 1800 N Unit 8
- 1777 N 275 E
- 1777 N 275 E Unit 7
- 342 E 1800 N
- 342 E 1800 N Unit 2
- 1751 N Fort Ln
- 238 E 1800 N
- 238 E 1800 N Unit 9
- 1786 N 225 E Unit 9
Your Personal Tour Guide
Ask me questions while you tour the home.