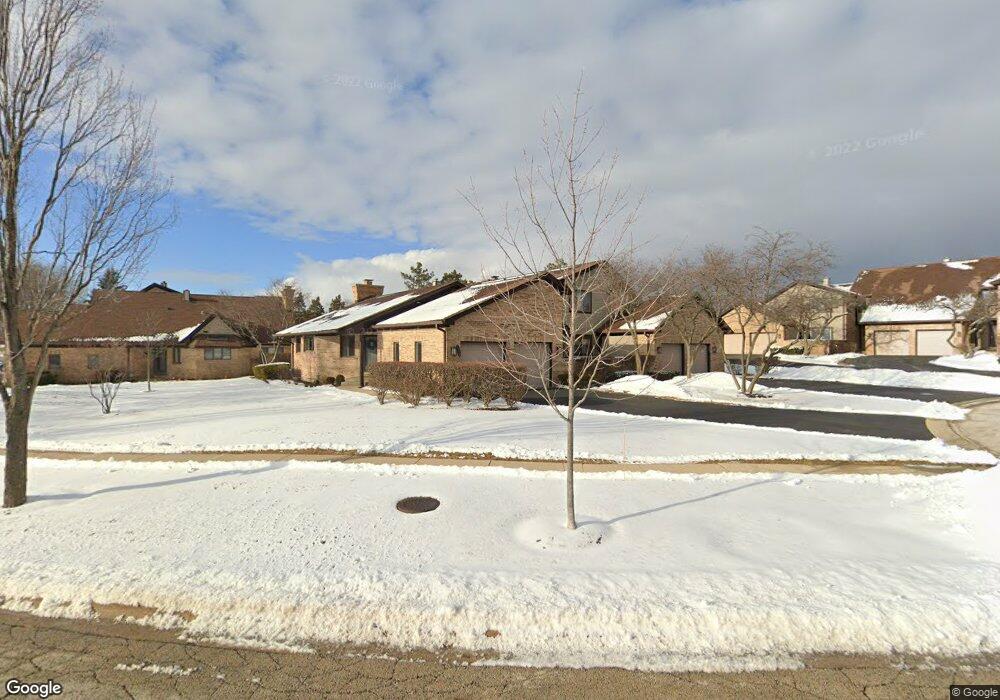
1790 Pebble Beach Dr Unit 1 Hoffman Estates, IL 60169
South Hoffman Estates NeighborhoodEstimated Value: $443,420 - $461,000
3
Beds
4
Baths
2,250
Sq Ft
$202/Sq Ft
Est. Value
About This Home
This home is located at 1790 Pebble Beach Dr Unit 1, Hoffman Estates, IL 60169 and is currently estimated at $453,807, approximately $201 per square foot. 1790 Pebble Beach Dr Unit 1 is a home located in Cook County with nearby schools including Neil Armstrong Elementary School, Dwight D Eisenhower Junior High School, and Hoffman Estates High School.
Ownership History
Date
Name
Owned For
Owner Type
Purchase Details
Closed on
May 14, 2015
Sold by
Iannotti Thomas and Iannotti Jeria
Bought by
Annotti Thomas and The Thomas L Iannotti Trust
Current Estimated Value
Purchase Details
Closed on
Oct 25, 2011
Sold by
Hill Joanne B
Bought by
Iannotti Thomas and Iannotti Jeria A
Home Financials for this Owner
Home Financials are based on the most recent Mortgage that was taken out on this home.
Original Mortgage
$228,000
Outstanding Balance
$155,999
Interest Rate
4.09%
Mortgage Type
New Conventional
Estimated Equity
$297,809
Purchase Details
Closed on
Sep 24, 1999
Sold by
Travis Charles M
Bought by
Hill Douglas C and Hill Joanne B
Home Financials for this Owner
Home Financials are based on the most recent Mortgage that was taken out on this home.
Original Mortgage
$225,100
Interest Rate
8%
Create a Home Valuation Report for This Property
The Home Valuation Report is an in-depth analysis detailing your home's value as well as a comparison with similar homes in the area
Home Values in the Area
Average Home Value in this Area
Purchase History
| Date | Buyer | Sale Price | Title Company |
|---|---|---|---|
| Annotti Thomas | -- | None Available | |
| Iannotti Thomas | $285,000 | Republic Title Co | |
| Hill Douglas C | $237,000 | -- |
Source: Public Records
Mortgage History
| Date | Status | Borrower | Loan Amount |
|---|---|---|---|
| Open | Iannotti Thomas | $228,000 | |
| Previous Owner | Hill Douglas C | $225,100 |
Source: Public Records
Tax History Compared to Growth
Tax History
| Year | Tax Paid | Tax Assessment Tax Assessment Total Assessment is a certain percentage of the fair market value that is determined by local assessors to be the total taxable value of land and additions on the property. | Land | Improvement |
|---|---|---|---|---|
| 2024 | $7,682 | $31,000 | $4,500 | $26,500 |
| 2023 | $7,378 | $31,000 | $4,500 | $26,500 |
| 2022 | $7,378 | $31,000 | $4,500 | $26,500 |
| 2021 | $4,601 | $19,728 | $3,260 | $16,468 |
| 2020 | $4,628 | $19,728 | $3,260 | $16,468 |
| 2019 | $4,611 | $21,921 | $3,260 | $18,661 |
| 2018 | $5,190 | $22,100 | $2,846 | $19,254 |
| 2017 | $5,132 | $22,100 | $2,846 | $19,254 |
| 2016 | $6,584 | $22,100 | $2,846 | $19,254 |
| 2015 | $5,846 | $22,700 | $2,484 | $20,216 |
| 2014 | $5,773 | $22,700 | $2,484 | $20,216 |
| 2013 | $5,593 | $22,700 | $2,484 | $20,216 |
Source: Public Records
Map
Nearby Homes
- 1121 Southbridge Ln
- 1698 Pebble Beach Dr
- 1103 Southbridge Ln
- 1375 Rebecca Dr Unit 318
- 1020 Denham Place Unit 1
- 1475 Rebecca Dr Unit 217
- 1912 Finchley Ct Unit 3
- 1415 N Oakmont Rd
- 1763 Bristol Walk Unit 1763
- 808 Bishop Ct Unit 2
- 775 Harmon Blvd
- 1475 Crowfoot Cir S
- 1685 Cornell Dr
- 1365 Blair Ln
- 1672 Cornell Dr
- 1352 W Oakmont Rd
- 1808 Fayette Walk Unit H
- 1704 Fayette Walk Unit B
- 1800 Huntington Blvd Unit AE615
- 1840 Huntington Blvd Unit 415
- 1792 Pebble Beach Dr
- 1788 Pebble Beach Dr Unit 1
- 1794 Pebble Beach Dr Unit 1
- 1786 Pebble Beach Dr
- 1796 Pebble Beach Dr
- 1784 Pebble Beach Dr
- 1798 Pebble Beach Dr
- 1782 Pebble Beach Dr
- 1800 Pebble Beach Dr Unit 1
- 1774 Pebble Beach Dr
- 1778 Pebble Beach Dr Unit 1
- 1776 Pebble Beach Dr
- 1700 Pebble Beach Dr Unit 2
- 1772 Pebble Beach Dr
- 1770 Pebble Beach Dr Unit 1
- 1768 Pebble Beach Dr Unit 1
- 1766 Pebble Beach Dr
- 1796 Monterey Ct Unit 4
- 1794 Monterey Ct Unit 4
- 1800 Monterey Ct