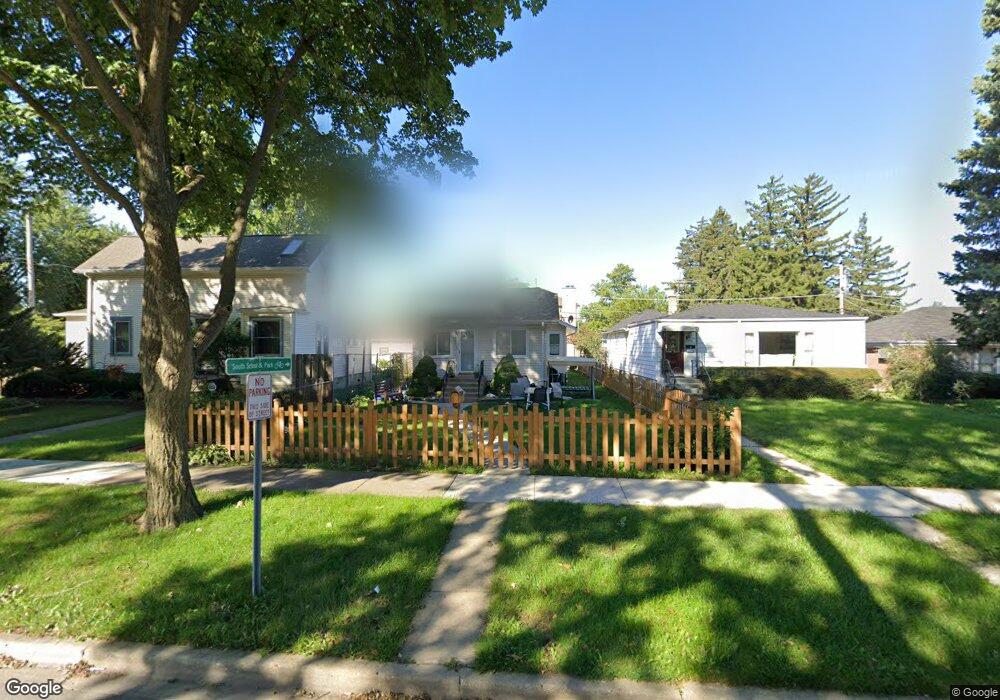
1790 White St Des Plaines, IL 60018
Estimated Value: $279,000 - $307,510
3
Beds
1
Bath
748
Sq Ft
$397/Sq Ft
Est. Value
About This Home
This home is located at 1790 White St, Des Plaines, IL 60018 and is currently estimated at $296,628, approximately $396 per square foot. 1790 White St is a home located in Cook County with nearby schools including South Elementary School, Algonquin Middle School, and Maine West High School.
Ownership History
Date
Name
Owned For
Owner Type
Purchase Details
Closed on
Mar 23, 2012
Sold by
North Shore Investment Holdings Inc
Bought by
Garcia Vega Antonio and Garcia Devega Paula G
Current Estimated Value
Home Financials for this Owner
Home Financials are based on the most recent Mortgage that was taken out on this home.
Original Mortgage
$113,059
Outstanding Balance
$78,773
Interest Rate
4.4%
Mortgage Type
FHA
Estimated Equity
$217,855
Purchase Details
Closed on
Jan 9, 2012
Sold by
Thrasher
Bought by
North Shore Investment Holdings Inc
Purchase Details
Closed on
Apr 25, 2001
Sold by
Thrasher Beatrice A
Bought by
Declaratio Thrasher Beatrice A and Beatrice A Thrasher Declaration Trust
Create a Home Valuation Report for This Property
The Home Valuation Report is an in-depth analysis detailing your home's value as well as a comparison with similar homes in the area
Home Values in the Area
Average Home Value in this Area
Purchase History
| Date | Buyer | Sale Price | Title Company |
|---|---|---|---|
| Garcia Vega Antonio | $116,000 | Old Republic National Title | |
| North Shore Investment Holdings Inc | $80,000 | None Available | |
| Declaratio Thrasher Beatrice A | -- | -- |
Source: Public Records
Mortgage History
| Date | Status | Borrower | Loan Amount |
|---|---|---|---|
| Open | Garcia Vega Antonio | $113,059 |
Source: Public Records
Tax History
| Year | Tax Paid | Tax Assessment Tax Assessment Total Assessment is a certain percentage of the fair market value that is determined by local assessors to be the total taxable value of land and additions on the property. | Land | Improvement |
|---|---|---|---|---|
| 2025 | $4,926 | $25,000 | $4,287 | $20,713 |
| 2024 | $4,926 | $22,000 | $3,572 | $18,428 |
| 2023 | $4,781 | $22,000 | $3,572 | $18,428 |
| 2022 | $4,781 | $22,000 | $3,572 | $18,428 |
| 2021 | $3,972 | $16,253 | $2,976 | $13,277 |
| 2020 | $3,974 | $16,253 | $2,976 | $13,277 |
| 2019 | $3,992 | $18,262 | $2,976 | $15,286 |
| 2018 | $4,368 | $18,041 | $2,619 | $15,422 |
| 2017 | $4,309 | $18,041 | $2,619 | $15,422 |
| 2016 | $4,319 | $18,041 | $2,619 | $15,422 |
| 2015 | $3,721 | $14,931 | $2,262 | $12,669 |
| 2014 | $3,659 | $14,931 | $2,262 | $12,669 |
| 2013 | $4,309 | $14,931 | $2,262 | $12,669 |
Source: Public Records
Map
Nearby Homes
- 1673 Linden St
- 1881 Orchard St
- 1445 Everett Ave
- 1643 Sycamore St
- 1857 Pine St
- 1726 E Lincoln Ave
- 1509 Center St
- 1895 Birch St
- 1640 S River Rd
- 2054 Birch St
- 1700 E Forest Ave
- 1370 Fargo Ave Unit E
- 1922 Fargo Ave
- 1990 Berry Ln
- 1080 Bogart St
- 1830 Dexter Ln
- 1541 Cooper St
- 2035 Fargo Ave
- 1030 Bogart St
- 1629 E Touhy Ave
Your Personal Tour Guide
Ask me questions while you tour the home.