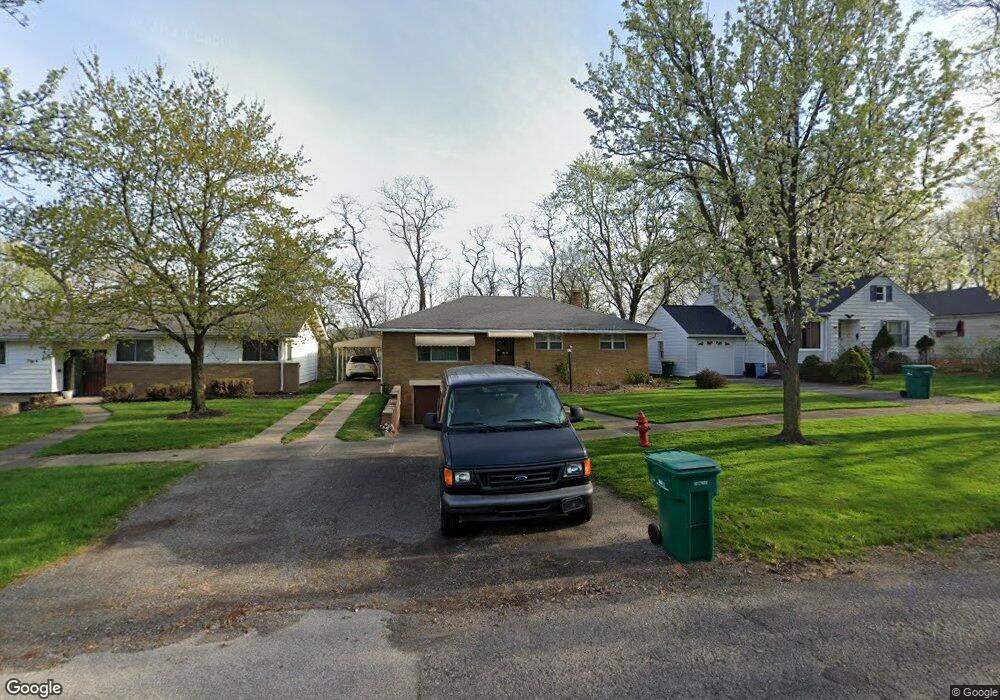
17901 Mccracken Rd Maple Heights, OH 44137
Estimated Value: $134,545 - $167,000
3
Beds
2
Baths
1,350
Sq Ft
$108/Sq Ft
Est. Value
About This Home
This home is located at 17901 Mccracken Rd, Maple Heights, OH 44137 and is currently estimated at $146,136, approximately $108 per square foot. 17901 Mccracken Rd is a home located in Cuyahoga County with nearby schools including Abraham Lincoln Elementary School, Rockside/ J.F. Kennedy School, and Barack Obama School.
Ownership History
Date
Name
Owned For
Owner Type
Purchase Details
Closed on
Jul 11, 2001
Sold by
Irby Darnell
Bought by
Irby Reaitta R
Current Estimated Value
Purchase Details
Closed on
Apr 20, 1999
Sold by
Jackson Willie B and Jackson Pearl M
Bought by
Irby Darnell and Irby Reaitta R
Home Financials for this Owner
Home Financials are based on the most recent Mortgage that was taken out on this home.
Original Mortgage
$82,857
Outstanding Balance
$21,208
Interest Rate
7.17%
Mortgage Type
FHA
Estimated Equity
$124,928
Purchase Details
Closed on
Aug 5, 1988
Sold by
Zmarzly Jean M
Bought by
Jackson Willie B
Purchase Details
Closed on
Jan 1, 1975
Bought by
Zmarzly Jean M
Create a Home Valuation Report for This Property
The Home Valuation Report is an in-depth analysis detailing your home's value as well as a comparison with similar homes in the area
Home Values in the Area
Average Home Value in this Area
Purchase History
| Date | Buyer | Sale Price | Title Company |
|---|---|---|---|
| Irby Reaitta R | -- | -- | |
| Irby Darnell | $82,900 | Executive Title Agency Corp | |
| Jackson Willie B | $62,900 | -- | |
| Zmarzly Jean M | -- | -- |
Source: Public Records
Mortgage History
| Date | Status | Borrower | Loan Amount |
|---|---|---|---|
| Open | Irby Darnell | $82,857 |
Source: Public Records
Tax History Compared to Growth
Tax History
| Year | Tax Paid | Tax Assessment Tax Assessment Total Assessment is a certain percentage of the fair market value that is determined by local assessors to be the total taxable value of land and additions on the property. | Land | Improvement |
|---|---|---|---|---|
| 2024 | $3,224 | $44,695 | $9,520 | $35,175 |
| 2023 | $2,642 | $24,510 | $5,500 | $19,010 |
| 2022 | $2,633 | $24,500 | $5,500 | $19,010 |
| 2021 | $2,805 | $24,500 | $5,500 | $19,010 |
| 2020 | $2,399 | $18,550 | $4,170 | $14,390 |
| 2019 | $2,383 | $53,000 | $11,900 | $41,100 |
| 2018 | $2,370 | $18,550 | $4,170 | $14,390 |
| 2017 | $2,263 | $17,150 | $3,850 | $13,300 |
| 2016 | $2,186 | $17,150 | $3,850 | $13,300 |
| 2015 | $2,189 | $17,150 | $3,850 | $13,300 |
| 2014 | $2,189 | $18,870 | $4,240 | $14,630 |
Source: Public Records
Map
Nearby Homes
- 5031 Cato St
- 5061 Philip Ave
- 5082 Philip Ave
- 5110 Philip Ave
- 5199 Arch St
- 5185 Clement Ave
- 5231 Philip Ave
- 16712 Kollin Ave
- 5239 Arch St
- 5234 Erwin St
- 5208 Clement Ave
- 5257 Philip Ave
- 4737 E 174th St
- 5212 Catherine St
- 17806 Tarkington Ave
- 5210 Theodore St
- 5320 Clement Ave
- 19309 Nitra Ave
- 5165 Camden Rd
- 5265 Bellview St
- 17781 Mccracken Rd
- 17905 Mccracken Rd
- 17741 Mccracken Rd
- 17909 Mccracken Rd
- 17913 Mccracken Rd
- 17721 Mccracken Rd
- 17917 Mccracken Rd
- 17900 Mccracken Rd
- 17766 Mccracken Rd
- 17904 Mccracken Rd
- 17908 Mccracken Rd
- 17762 Mccracken Rd
- 17711 Mccracken Rd
- 17914 Mccracken Rd
- 17750 Mccracken Rd
- 17991 Mccracken Rd
- 17916 Mccracken Rd
- 17740 Mccracken Rd
- 5032 Cato St
- 17701 Mccracken Rd