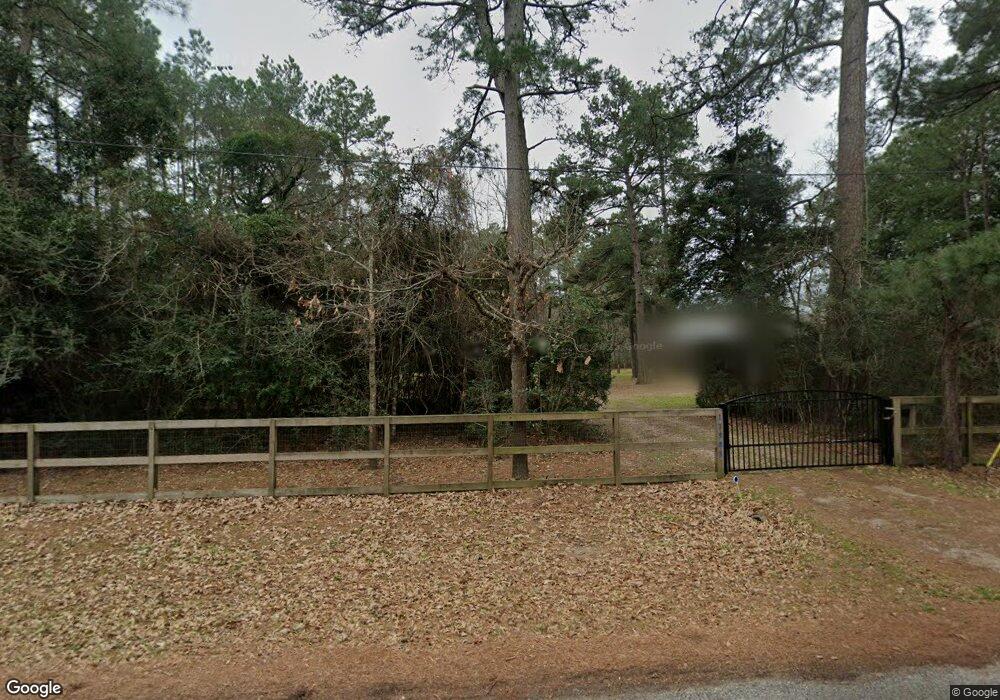
17903 Winding Creek Ln Magnolia, TX 77355
Estimated Value: $253,000 - $319,515
3
Beds
2
Baths
1,372
Sq Ft
$206/Sq Ft
Est. Value
About This Home
This home is located at 17903 Winding Creek Ln, Magnolia, TX 77355 and is currently estimated at $283,129, approximately $206 per square foot. 17903 Winding Creek Ln is a home located in Montgomery County with nearby schools including Nichols Sawmill Elementary School, Magnolia Sixth Grade Campus, and Magnolia Junior High School.
Ownership History
Date
Name
Owned For
Owner Type
Purchase Details
Closed on
Nov 13, 2020
Sold by
Gonzalez Jorge L and Gonzalez Maria C
Bought by
Gonzalez Jorge L
Current Estimated Value
Home Financials for this Owner
Home Financials are based on the most recent Mortgage that was taken out on this home.
Original Mortgage
$151,000
Outstanding Balance
$109,068
Interest Rate
2.8%
Mortgage Type
New Conventional
Estimated Equity
$174,061
Purchase Details
Closed on
Dec 22, 2014
Sold by
Parr Arnold D and Parr Valerie
Bought by
Gonzalez Jorge L and Gonzalez Jorge L
Home Financials for this Owner
Home Financials are based on the most recent Mortgage that was taken out on this home.
Original Mortgage
$148,755
Interest Rate
4.04%
Mortgage Type
FHA
Purchase Details
Closed on
May 13, 1992
Sold by
Stanley Development Company
Bought by
Gonzalez Jorege L and Gonzalez Maria C
Create a Home Valuation Report for This Property
The Home Valuation Report is an in-depth analysis detailing your home's value as well as a comparison with similar homes in the area
Home Values in the Area
Average Home Value in this Area
Purchase History
| Date | Buyer | Sale Price | Title Company |
|---|---|---|---|
| Gonzalez Jorge L | -- | None Available | |
| Gonzalez Jorge L | -- | Stewart Title | |
| Gonzalez Jorege L | -- | -- |
Source: Public Records
Mortgage History
| Date | Status | Borrower | Loan Amount |
|---|---|---|---|
| Open | Gonzalez Jorge L | $151,000 | |
| Closed | Gonzalez Jorge L | $148,755 |
Source: Public Records
Tax History Compared to Growth
Tax History
| Year | Tax Paid | Tax Assessment Tax Assessment Total Assessment is a certain percentage of the fair market value that is determined by local assessors to be the total taxable value of land and additions on the property. | Land | Improvement |
|---|---|---|---|---|
| 2025 | $3,265 | $289,121 | $154,202 | $134,919 |
| 2024 | $2,879 | $283,765 | $154,202 | $129,563 |
| 2023 | $2,879 | $258,560 | $154,200 | $179,790 |
| 2022 | $4,148 | $235,050 | $154,200 | $80,850 |
| 2021 | $4,305 | $231,630 | $77,880 | $153,750 |
| 2020 | $2,261 | $223,460 | $77,880 | $145,580 |
| 2019 | $2,181 | $221,870 | $77,880 | $149,220 |
| 2018 | $1,803 | $98,470 | $24,780 | $74,940 |
| 2017 | $1,898 | $89,520 | $24,780 | $80,030 |
| 2016 | $1,726 | $81,380 | $8,850 | $72,530 |
| 2015 | $613 | $150,070 | $17,700 | $132,370 |
| 2014 | $613 | $61,230 | $17,700 | $43,530 |
Source: Public Records
Map
Nearby Homes
- 17910 Sea Turtle Ct
- 27011 Sunset Dr
- 21242 Natalia Grove
- 27119 Seahorse Ln
- 21610 Meadowsweet Dr
- 27141 Nichols Sawmill Rd
- 26603 N Marek Ln
- 17819 Indigo Hills Dr
- 24754 Majestic Cone Ln
- 26523 S Carrol Ln
- 17503 Heaton Ct
- 27114 N Heaton Ln
- 22102 Badger Hollow Dr
- 26530 S Dogwood Ln
- 17103 Indigo Hills Dr
- 26115 Country Woods Trail
- 17447 Country Skies
- 26718 Stagecoach Crossing Dr
- 00000 Butera Rd
- 19830 Turtle Dove Ln
- 02 Sea Turtle Ln
- 01 Sea Turtle Ln
- 17914 Sea Turtle Ct
- 17918 Sea Turtle Ct
- 26814 Sea Turtle Ln
- 17915 Winding Creek Ln
- 26911 Sea Turtle Ln
- 26902 Sea Turtle Ln
- 26902 Seahorse Ln
- 18002 Sea Turtle Ct
- 26806 Sea Turtle Ln
- 26906 Sea Turtle Ln
- 26910 Seahorse Ln
- 17915 Sea Turtle Ct
- 17911 Sea Turtle Ct
- 26914 Seahorse Ln
- 17903 Sea Turtle Ct
- 18011 Winding Creek Ln
- 17919 Sea Turtle Ct
- 17811 Winding Creek Ln