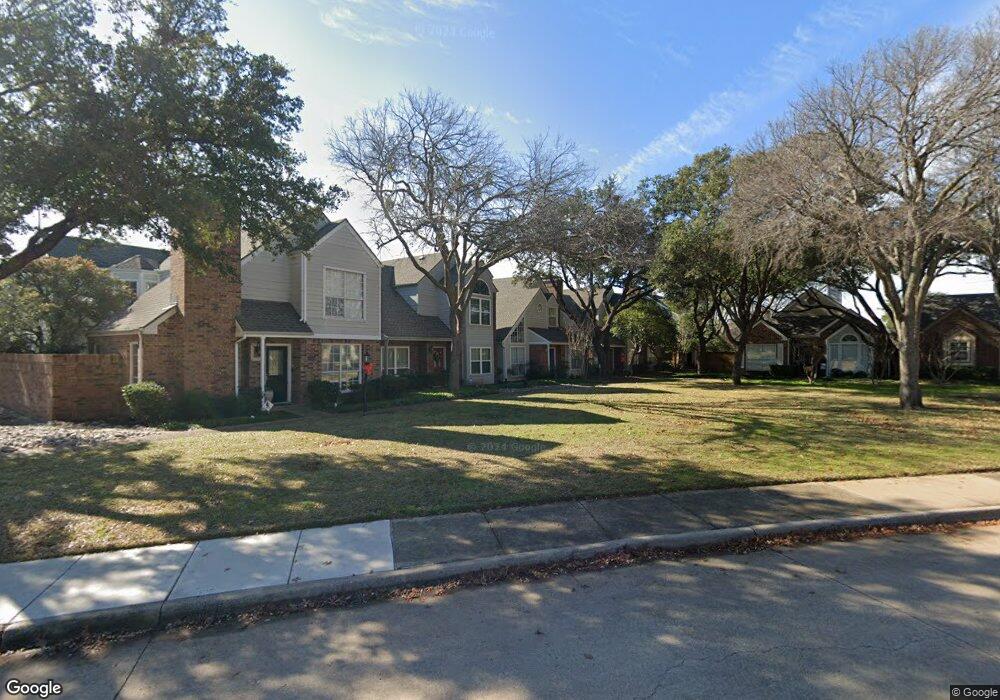
17905 Windflower Way Unit 110 Dallas, TX 75252
Prestonwood West NeighborhoodEstimated Value: $368,000 - $434,000
3
Beds
3
Baths
1,850
Sq Ft
$216/Sq Ft
Est. Value
About This Home
This home is located at 17905 Windflower Way Unit 110, Dallas, TX 75252 and is currently estimated at $399,381, approximately $215 per square foot. 17905 Windflower Way Unit 110 is a home located in Collin County with nearby schools including Frankford Middle, Shepton High School, and Plano West Senior High School.
Ownership History
Date
Name
Owned For
Owner Type
Purchase Details
Closed on
Apr 14, 2010
Sold by
Raley Jackson L
Bought by
Larson Kathryn Raley
Current Estimated Value
Purchase Details
Closed on
Aug 29, 2008
Sold by
Jersin Wayne N and Jersin Linda N
Bought by
Raley Jackson L
Purchase Details
Closed on
Mar 15, 2007
Sold by
Myckleby Lori Ann and Myckleby Jim R
Bought by
Jersin Wayne N and Jersin Linda N
Home Financials for this Owner
Home Financials are based on the most recent Mortgage that was taken out on this home.
Original Mortgage
$140,000
Interest Rate
6.32%
Mortgage Type
Purchase Money Mortgage
Purchase Details
Closed on
Dec 13, 1996
Sold by
Leslie Daniel Scott
Bought by
Myckleby Lori Ann
Purchase Details
Closed on
Sep 2, 1993
Sold by
Estate Of Jane C Vickery
Bought by
Myckleby Lori A and Myckleby Jim R
Home Financials for this Owner
Home Financials are based on the most recent Mortgage that was taken out on this home.
Original Mortgage
$75,000
Interest Rate
7.23%
Create a Home Valuation Report for This Property
The Home Valuation Report is an in-depth analysis detailing your home's value as well as a comparison with similar homes in the area
Home Values in the Area
Average Home Value in this Area
Purchase History
| Date | Buyer | Sale Price | Title Company |
|---|---|---|---|
| Larson Kathryn Raley | -- | Rtt | |
| Raley Jackson L | -- | Lttc | |
| Jersin Wayne N | -- | Ltt | |
| Myckleby Lori Ann | -- | -- | |
| Myckleby Lori A | -- | -- |
Source: Public Records
Mortgage History
| Date | Status | Borrower | Loan Amount |
|---|---|---|---|
| Previous Owner | Jersin Wayne N | $140,000 | |
| Previous Owner | Myckleby Lori A | $75,000 |
Source: Public Records
Tax History Compared to Growth
Tax History
| Year | Tax Paid | Tax Assessment Tax Assessment Total Assessment is a certain percentage of the fair market value that is determined by local assessors to be the total taxable value of land and additions on the property. | Land | Improvement |
|---|---|---|---|---|
| 2025 | $5,084 | $372,274 | $90,000 | $282,274 |
| 2024 | $5,084 | $344,306 | $90,000 | $324,643 |
| 2023 | $5,084 | $313,005 | $115,000 | $262,561 |
| 2022 | $6,372 | $284,550 | $90,000 | $248,893 |
| 2021 | $6,062 | $267,490 | $70,000 | $197,490 |
| 2020 | $5,574 | $235,165 | $50,000 | $185,165 |
| 2019 | $5,331 | $215,160 | $55,000 | $160,160 |
| 2018 | $5,851 | $234,846 | $50,000 | $185,680 |
| 2017 | $5,319 | $258,505 | $40,000 | $218,505 |
| 2016 | $4,874 | $194,087 | $16,451 | $177,636 |
| 2015 | $2,816 | $193,344 | $16,451 | $176,893 |
Source: Public Records
Map
Nearby Homes
- 18011 Windflower Way
- 5940 Rosebud Dr
- 17860 Windflower Way Unit 1704
- 5807 Covehaven Dr
- 6020 Fallsview Ln
- 5904 Richwater Dr
- 5944 Still Forest Dr
- 5828 Fallsview Ln
- 6014 Glen Heather Dr
- 5909 Kenswick Ct
- 6204 Crested Butte Dr
- 18333 Roehampton Dr Unit 1117
- 18333 Roehampton Dr Unit 513
- 18333 Roehampton Dr Unit 225
- 18333 Roehampton Dr Unit 927
- 18333 Roehampton Dr Unit 921
- 18333 Roehampton Dr Unit 813
- 6076 Thursby Ave
- 18231 Frankford Lakes Cir
- 6206 Berthoud Pass
- 17905 Windflower Way Unit 109
- 17905 Windflower Way Unit 107
- 17905 Windflower Way Unit 112
- 17905 Windflower Way Unit 111
- 17915 Windflower Way Unit 101
- 17915 Windflower Way Unit 104
- 17915 Windflower Way Unit 103
- 17915 Windflower Way Unit 102
- 17815 Windflower Way Unit 102
- 17815 Windflower Way Unit 112
- 17815 Windflower Way Unit 111
- 17815 Windflower Way Unit 103
- 17815 Windflower Way Unit 109
- 17815 Windflower Way Unit 105
- 17815 Windflower Way Unit 110
- 17815 Windflower Way Unit 104
- 17815 Windflower Way Unit 107
- 17815 Windflower Way Unit 106
- 17815 Windflower Way Unit 101
- 17827 Windflower Way Unit 108