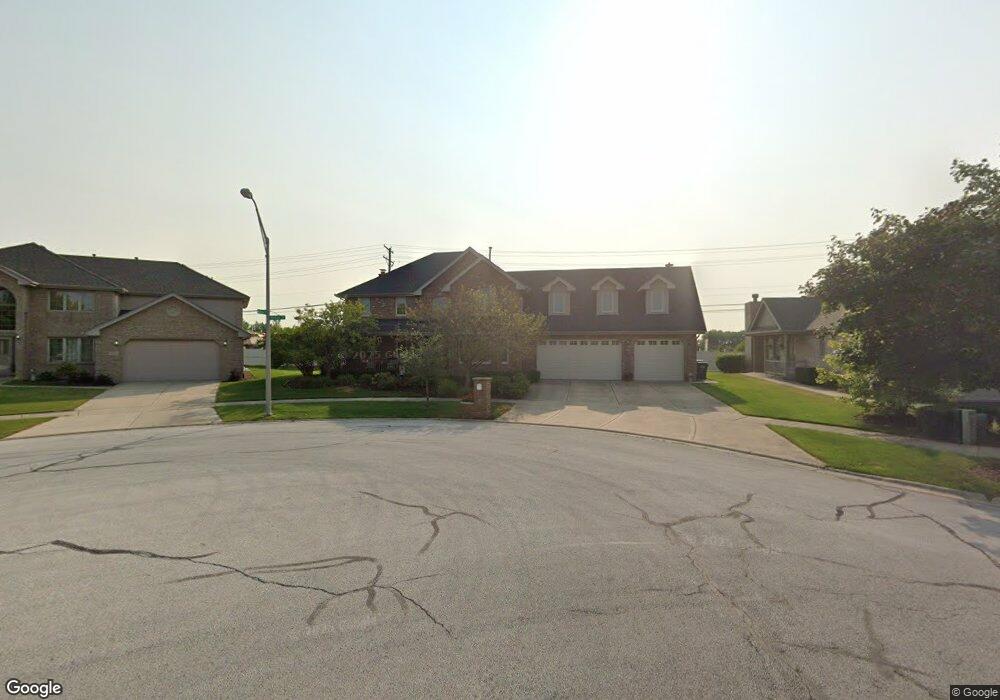
17907 Nielsen Dr Tinley Park, IL 60477
Central Tinley Park NeighborhoodEstimated Value: $585,900 - $651,000
4
Beds
3
Baths
3,500
Sq Ft
$175/Sq Ft
Est. Value
About This Home
This home is located at 17907 Nielsen Dr, Tinley Park, IL 60477 and is currently estimated at $612,475, approximately $174 per square foot. 17907 Nielsen Dr is a home located in Cook County with nearby schools including Millennium Elementary School, Virgil I Grissom Middle School, and Victor J Andrew High School.
Ownership History
Date
Name
Owned For
Owner Type
Purchase Details
Closed on
Mar 17, 2014
Sold by
Standard Bank & Trust Company
Bought by
Tinley Park Park District
Current Estimated Value
Purchase Details
Closed on
Jul 29, 2010
Sold by
George Christopher W and George Lisa J
Bought by
Runser Daniel J and Runser Kathleen M
Home Financials for this Owner
Home Financials are based on the most recent Mortgage that was taken out on this home.
Original Mortgage
$270,000
Interest Rate
4.81%
Mortgage Type
New Conventional
Purchase Details
Closed on
Jul 16, 2002
Sold by
State Bank Of Countryside
Bought by
George Christopher W and George Lisa J
Home Financials for this Owner
Home Financials are based on the most recent Mortgage that was taken out on this home.
Original Mortgage
$292,000
Interest Rate
6.7%
Create a Home Valuation Report for This Property
The Home Valuation Report is an in-depth analysis detailing your home's value as well as a comparison with similar homes in the area
Home Values in the Area
Average Home Value in this Area
Purchase History
| Date | Buyer | Sale Price | Title Company |
|---|---|---|---|
| Tinley Park Park District | -- | None Available | |
| Runser Daniel J | $400,000 | Fidelity National Title | |
| George Christopher W | $365,000 | -- |
Source: Public Records
Mortgage History
| Date | Status | Borrower | Loan Amount |
|---|---|---|---|
| Previous Owner | Runser Daniel J | $270,000 | |
| Previous Owner | George Christopher W | $292,000 |
Source: Public Records
Tax History Compared to Growth
Tax History
| Year | Tax Paid | Tax Assessment Tax Assessment Total Assessment is a certain percentage of the fair market value that is determined by local assessors to be the total taxable value of land and additions on the property. | Land | Improvement |
|---|---|---|---|---|
| 2024 | $12,129 | $47,000 | $11,896 | $35,104 |
| 2023 | $10,821 | $47,000 | $11,896 | $35,104 |
| 2022 | $10,821 | $33,774 | $5,132 | $28,642 |
| 2021 | $10,504 | $33,772 | $5,131 | $28,641 |
| 2020 | $10,307 | $33,772 | $5,131 | $28,641 |
| 2019 | $10,627 | $36,197 | $4,665 | $31,532 |
| 2018 | $10,398 | $36,197 | $4,665 | $31,532 |
| 2017 | $10,139 | $36,197 | $4,665 | $31,532 |
| 2016 | $10,064 | $32,800 | $4,198 | $28,602 |
| 2015 | $9,915 | $32,800 | $4,198 | $28,602 |
| 2014 | $11,363 | $34,881 | $4,198 | $30,683 |
| 2013 | $11,854 | $39,250 | $4,198 | $35,052 |
Source: Public Records
Map
Nearby Homes
- 8036 Blarney Rd
- 7783 Bristol Park Dr Unit 1-SW
- 7767 Bristol Park Dr Unit 7767
- 7755 Bristol Park Dr Unit 1NE
- 7925 Belle Rive Ct
- 8416 Stratford Dr Unit 8416
- 7727 Bristol Park Dr
- 8423 Stratford Dr Unit 8423
- 8313 Aster Ln
- 18261 Kirby Dr Unit 2918261
- 8030 Valley View Dr
- 7517 175th St Unit 331
- 7912 172nd Place
- 17631 Dover Ct
- Fremont Plan at Radcliffe Place
- Calysta Plan at Radcliffe Place
- Danbury Plan at Radcliffe Place
- Briarcliffe Plan at Radcliffe Place
- Eden Plan at Radcliffe Place
- Amberwood Plan at Radcliffe Place
- 17919 Nielsen Dr
- 17917 Nielsen Dr
- 8000 Mallow Dr
- 17921 Nielsen Dr
- 8006 Mallow Dr
- 17923 Nielsen Dr
- 8013 Mallow Dr
- 17927 Nielsen Dr
- 8012 Mallow Dr
- 17929 Nielsen Dr
- 8012 Blarney Rd
- 17931 Nielsen Dr
- 8019 Mallow Dr
- 8018 Mallow Dr
- 17933 Nielsen Dr
- 8018 Blarney Rd
- 8015 Apache Trail
- 17855 Navajo Trace
- 17937 Nielsen Dr
- 8024 Mallow Dr