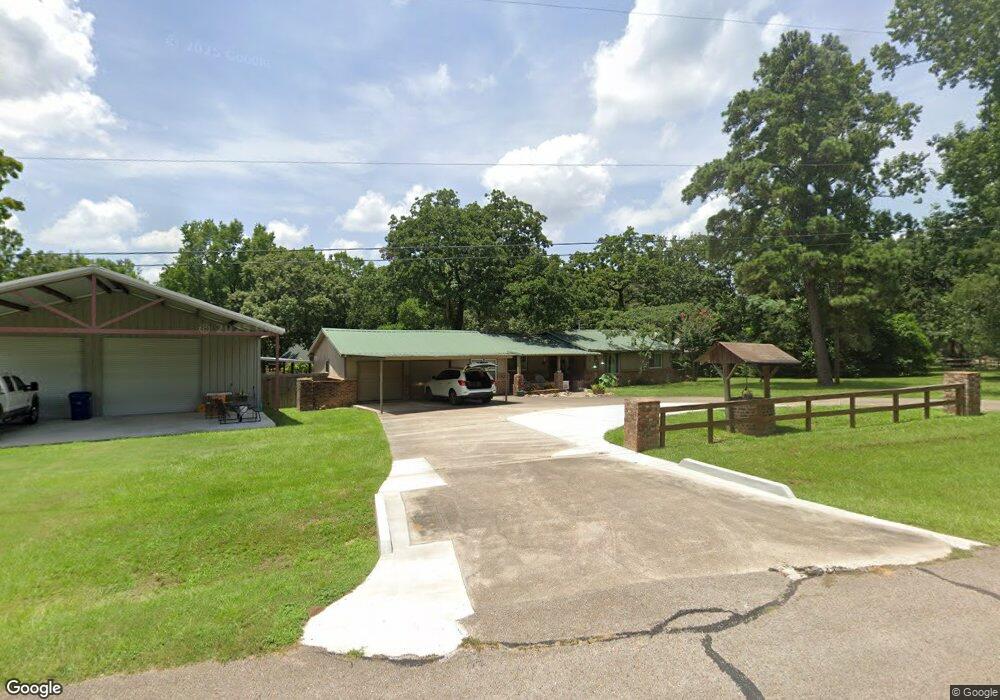
17908 Lookout Lake Ln Magnolia, TX 77354
Estimated Value: $238,826 - $348,000
--
Bed
2
Baths
1,404
Sq Ft
$212/Sq Ft
Est. Value
About This Home
This home is located at 17908 Lookout Lake Ln, Magnolia, TX 77354 and is currently estimated at $297,457, approximately $211 per square foot. 17908 Lookout Lake Ln is a home located in Montgomery County with nearby schools including Willie E. Williams Elementary School, Magnolia Sixth Grade Campus, and Magnolia Junior High School.
Ownership History
Date
Name
Owned For
Owner Type
Purchase Details
Closed on
Apr 12, 2021
Sold by
Kana Gary and Kana Barbara
Bought by
Kana Dillon
Current Estimated Value
Purchase Details
Closed on
Mar 8, 2017
Sold by
Mullins Maurice and Mullins Maurice
Bought by
Kana Gary and Kana Barbara
Purchase Details
Closed on
Feb 22, 2017
Sold by
Mullins Karen
Bought by
Mullins Maurice
Purchase Details
Closed on
Mar 26, 1999
Sold by
Albinus Mary Sue
Bought by
Patton Sean and Patton Lisa
Home Financials for this Owner
Home Financials are based on the most recent Mortgage that was taken out on this home.
Original Mortgage
$56,610
Interest Rate
6.82%
Purchase Details
Closed on
Oct 24, 1997
Sold by
Albinus Jerry
Bought by
Mullins Maurice
Purchase Details
Closed on
Feb 29, 1996
Sold by
Albinus Jerry Gideon
Bought by
Albinus Mary Sue
Create a Home Valuation Report for This Property
The Home Valuation Report is an in-depth analysis detailing your home's value as well as a comparison with similar homes in the area
Home Values in the Area
Average Home Value in this Area
Purchase History
| Date | Buyer | Sale Price | Title Company |
|---|---|---|---|
| Kana Dillon | -- | Accommodation | |
| Kana Gary | -- | Stewart Title | |
| Mullins Maurice | -- | Stewart Title | |
| Mullins Maurice | -- | Stewart Title | |
| Patton Sean | -- | -- | |
| Mullins Maurice | -- | -- | |
| Albinus Mary Sue | -- | -- |
Source: Public Records
Mortgage History
| Date | Status | Borrower | Loan Amount |
|---|---|---|---|
| Previous Owner | Patton Sean | $56,610 |
Source: Public Records
Tax History Compared to Growth
Tax History
| Year | Tax Paid | Tax Assessment Tax Assessment Total Assessment is a certain percentage of the fair market value that is determined by local assessors to be the total taxable value of land and additions on the property. | Land | Improvement |
|---|---|---|---|---|
| 2025 | $2,411 | $213,932 | -- | -- |
| 2024 | $2,500 | $194,484 | $70,200 | $124,284 |
| 2023 | $2,500 | $195,290 | $70,200 | $125,090 |
| 2022 | $4,037 | $188,680 | $58,500 | $0 |
| 2021 | $3,883 | $171,530 | $21,060 | $150,470 |
| 2020 | $4,315 | $173,430 | $21,060 | $157,840 |
| 2019 | $3,912 | $157,660 | $21,060 | $136,600 |
| 2018 | $3,414 | $152,980 | $12,870 | $197,120 |
| 2017 | $3,593 | $139,070 | $12,870 | $141,740 |
| 2016 | $3,266 | $126,430 | $12,870 | $141,740 |
| 2015 | $2,488 | $114,940 | $12,870 | $133,570 |
| 2014 | $2,488 | $104,490 | $3,900 | $165,750 |
Source: Public Records
Map
Nearby Homes
- 307 Hidden Bend Ct
- 587 Black Bronco Rd
- 522 Black Bronco Rd
- Fredericksburg Plan at Timber Hollow
- McKinney Plan at Timber Hollow
- Palmetto Plan at Timber Hollow
- Huntsville Plan at Timber Hollow
- Summerfield Plan at Timber Hollow
- Cameron Plan at Timber Hollow
- Crockett Plan at Timber Hollow
- Sedona Plan at Timber Hollow
- 402 Placid Lake Ln
- 714 Satterwhite Farms Ln
- 635 Little Twig Ln
- 623 Running Iron Ln
- 17720 Gold Saddle Ln
- 630 Running Iron Ln
- 613 Blue Mockingbird Ct
- 106 Abilene Dr
- Whitetail Plan at Magnolia Ridge - Cottage Collection
- 17910 Lookout Lake Ln
- 17914 Lookout Lake Ln
- 723 Dogwood Trail
- 314 Hidden Bend Ct
- 321 Treaty Oak Ct
- 210 Old Pines Ln
- 21287 Hidden Bend Loop
- 218 Old Pines Ln
- 316 Treaty Oak Ct
- 21230 Hidden Bend Loop
- 214 Old Pines Ln
- 204 Green Hills Ct
- 302 Hidden Bend Ct
- 21267 Hidden Bend Loop
- 21282 Hidden Bend Loop
- 323 Hidden Bend Ct
- 21259 Hidden Bend Loop
- 325 Treaty Oak Ct
- 311 Hidden Bend Ct
- 309 Treaty Oak Ct