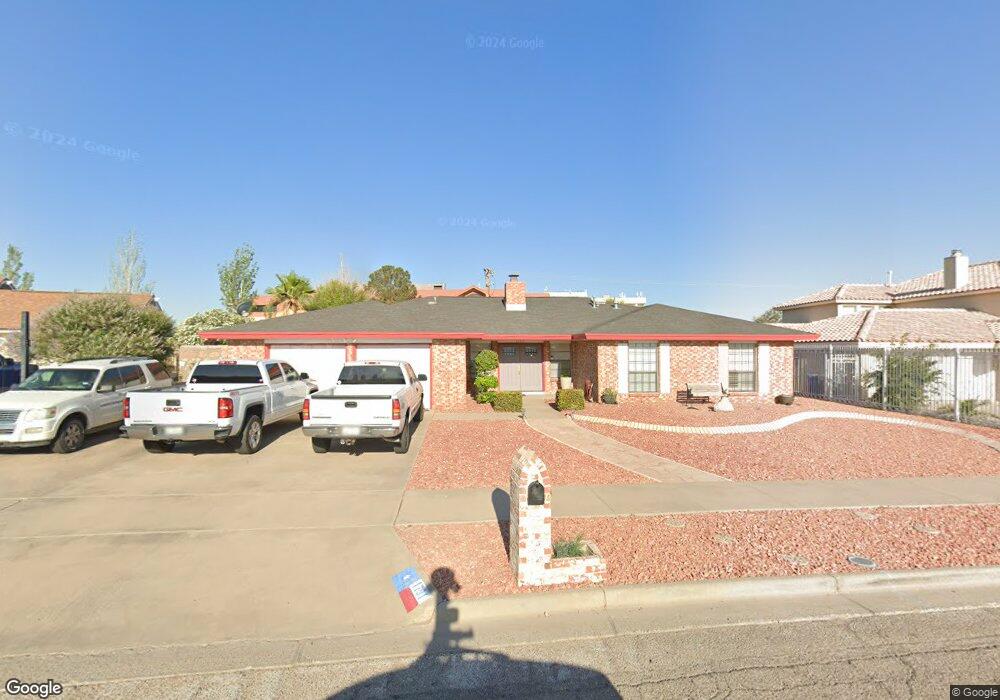
1791 Billy Casper Dr El Paso, TX 79936
Vista Hills NeighborhoodEstimated Value: $310,000 - $391,000
4
Beds
2
Baths
2,200
Sq Ft
$161/Sq Ft
Est. Value
About This Home
This home is located at 1791 Billy Casper Dr, El Paso, TX 79936 and is currently estimated at $353,218, approximately $160 per square foot. 1791 Billy Casper Dr is a home located in El Paso County with nearby schools including Tierra Del Sol Elementary School, J M Hanks High School, and EL PASO LEADERSHIP ACADEMY - MIDDLE EAST.
Ownership History
Date
Name
Owned For
Owner Type
Purchase Details
Closed on
May 30, 2007
Sold by
Porras Gary Paul and Porras Cecilia
Bought by
Guerra Ruben David and Guerra Patricia
Current Estimated Value
Home Financials for this Owner
Home Financials are based on the most recent Mortgage that was taken out on this home.
Original Mortgage
$251,750
Outstanding Balance
$153,878
Interest Rate
6.17%
Mortgage Type
Purchase Money Mortgage
Estimated Equity
$199,340
Purchase Details
Closed on
Dec 19, 2006
Sold by
Stevens Mary Frances
Bought by
Porras Gary Paul and Porras Cecilia
Home Financials for this Owner
Home Financials are based on the most recent Mortgage that was taken out on this home.
Original Mortgage
$164,000
Interest Rate
6.27%
Mortgage Type
Purchase Money Mortgage
Purchase Details
Closed on
May 26, 2004
Sold by
Ruhl Robert E and Ruhl Sandra Kay
Bought by
Stevens Mary Frances
Create a Home Valuation Report for This Property
The Home Valuation Report is an in-depth analysis detailing your home's value as well as a comparison with similar homes in the area
Home Values in the Area
Average Home Value in this Area
Purchase History
| Date | Buyer | Sale Price | Title Company |
|---|---|---|---|
| Guerra Ruben David | -- | Lawyers Title Far East | |
| Porras Gary Paul | -- | None Available | |
| Stevens Mary Frances | -- | -- |
Source: Public Records
Mortgage History
| Date | Status | Borrower | Loan Amount |
|---|---|---|---|
| Open | Guerra Ruben David | $251,750 | |
| Previous Owner | Porras Gary Paul | $164,000 |
Source: Public Records
Tax History
| Year | Tax Paid | Tax Assessment Tax Assessment Total Assessment is a certain percentage of the fair market value that is determined by local assessors to be the total taxable value of land and additions on the property. | Land | Improvement |
|---|---|---|---|---|
| 2025 | $6,203 | $334,737 | -- | -- |
| 2024 | $6,203 | $304,306 | -- | -- |
| 2023 | $6,203 | $276,642 | -- | -- |
| 2022 | $7,810 | $251,493 | $0 | $0 |
| 2021 | $7,432 | $252,339 | $38,593 | $213,746 |
| 2020 | $6,565 | $207,845 | $31,183 | $176,662 |
| 2018 | $6,358 | $204,465 | $31,183 | $173,282 |
| 2017 | $6,068 | $198,502 | $31,183 | $167,319 |
| 2016 | $6,068 | $198,502 | $31,183 | $167,319 |
| 2015 | $4,970 | $198,502 | $31,183 | $167,319 |
| 2014 | $4,970 | $202,063 | $31,183 | $170,880 |
Source: Public Records
Map
Nearby Homes
- 1605 Billy Casper Dr
- 11216 Bill Hill Dr
- 1901 Bobby Jones Dr
- 1856 Mike Hill Dr
- 11213 Leo Collins Dr
- 1617 Tommy Aaron Dr
- 2201 Trawood Dr
- 11012 Bob Stone Dr
- 10953 Gary Player Dr
- 11013 Bob Stone Dr
- 2021 Oceanside Dr
- 11105 La Quinta Place Unit C
- 11268 Enid Wilson Ln
- 1613 Larry Wadkins Dr
- 2037 Anise Dr
- 1664 Dick Ritter St
- 1700 Jerry Abbott St
- 2032 Solano Dr
- 1672 Lou Graham Dr
- 10904 Don January Dr
- 1787 Billy Casper Dr
- 1795 Billy Casper Dr
- 1783 Billy Casper Dr
- 1799 Billy Casper Dr
- 1790 Billy Casper Dr
- 1794 Billy Casper Dr
- 1786 Billy Casper Dr
- 1798 Billy Casper Dr
- 1779 Billy Casper Dr
- 1782 Billy Casper Dr
- 11108 Bill Hill Dr
- 11104 Bill Hill Dr
- 11112 Bill Hill Dr
- 1778 Billy Casper Dr
- 1801 Billy Casper Dr
- 1800 Billy Casper Dr
- 1800 Billy Casper Dr Unit 1
- 11116 Bill Hill Dr
- 1805 Billy Casper Dr
- 11008 Bill Hill Dr
Your Personal Tour Guide
Ask me questions while you tour the home.