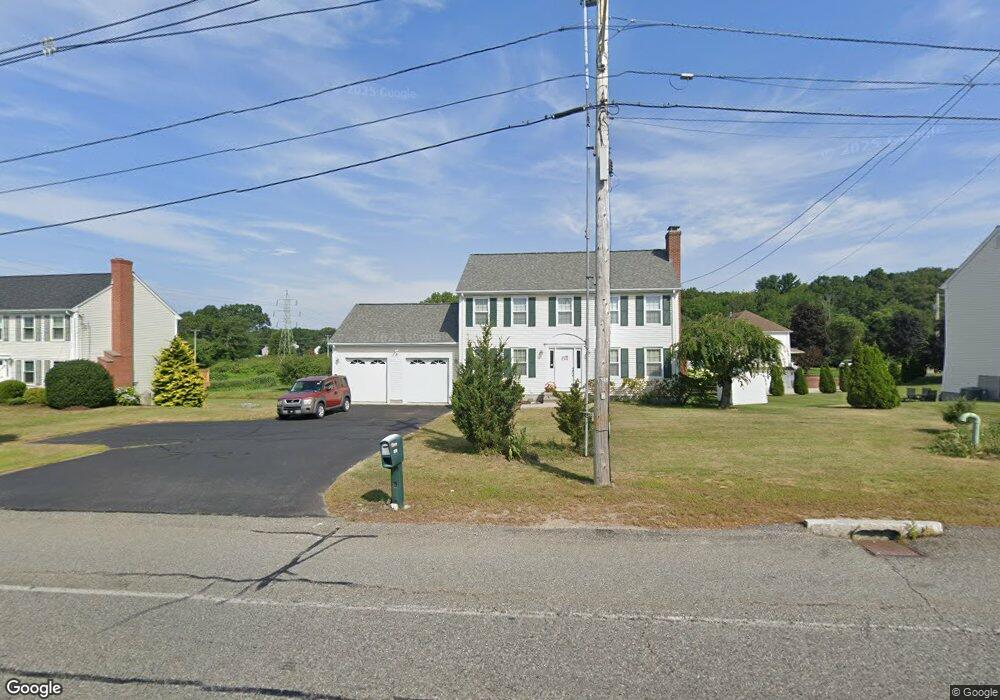
1791 County St Attleboro, MA 02703
Estimated Value: $603,071 - $666,000
3
Beds
3
Baths
1,728
Sq Ft
$363/Sq Ft
Est. Value
About This Home
This home is located at 1791 County St, Attleboro, MA 02703 and is currently estimated at $627,768, approximately $363 per square foot. 1791 County St is a home located in Bristol County with nearby schools including Hill-Roberts Elementary School, Robert J. Coelho Middle School, and Attleboro High School.
Ownership History
Date
Name
Owned For
Owner Type
Purchase Details
Closed on
Sep 22, 2000
Sold by
W B Constr & Dev Inc
Bought by
Cahoon Brenda A
Current Estimated Value
Home Financials for this Owner
Home Financials are based on the most recent Mortgage that was taken out on this home.
Original Mortgage
$75,000
Outstanding Balance
$27,141
Interest Rate
8%
Mortgage Type
Purchase Money Mortgage
Estimated Equity
$600,627
Create a Home Valuation Report for This Property
The Home Valuation Report is an in-depth analysis detailing your home's value as well as a comparison with similar homes in the area
Home Values in the Area
Average Home Value in this Area
Purchase History
| Date | Buyer | Sale Price | Title Company |
|---|---|---|---|
| Cahoon Brenda A | $234,900 | -- |
Source: Public Records
Mortgage History
| Date | Status | Borrower | Loan Amount |
|---|---|---|---|
| Open | Cahoon Brenda A | $75,000 |
Source: Public Records
Tax History
| Year | Tax Paid | Tax Assessment Tax Assessment Total Assessment is a certain percentage of the fair market value that is determined by local assessors to be the total taxable value of land and additions on the property. | Land | Improvement |
|---|---|---|---|---|
| 2025 | $5,935 | $472,900 | $138,100 | $334,800 |
| 2024 | $5,782 | $454,200 | $138,100 | $316,100 |
| 2023 | $5,251 | $383,600 | $125,500 | $258,100 |
| 2022 | $5,024 | $347,700 | $119,700 | $228,000 |
| 2021 | $5,001 | $337,900 | $115,100 | $222,800 |
| 2020 | $4,793 | $329,200 | $111,700 | $217,500 |
| 2019 | $4,669 | $329,700 | $109,500 | $220,200 |
| 2018 | $4,510 | $304,300 | $106,300 | $198,000 |
| 2017 | $4,432 | $304,600 | $106,300 | $198,300 |
| 2016 | $4,289 | $289,400 | $99,300 | $190,100 |
| 2015 | $4,164 | $283,100 | $99,300 | $183,800 |
| 2014 | $4,093 | $275,600 | $94,100 | $181,500 |
Source: Public Records
Map
Nearby Homes
Your Personal Tour Guide
Ask me questions while you tour the home.