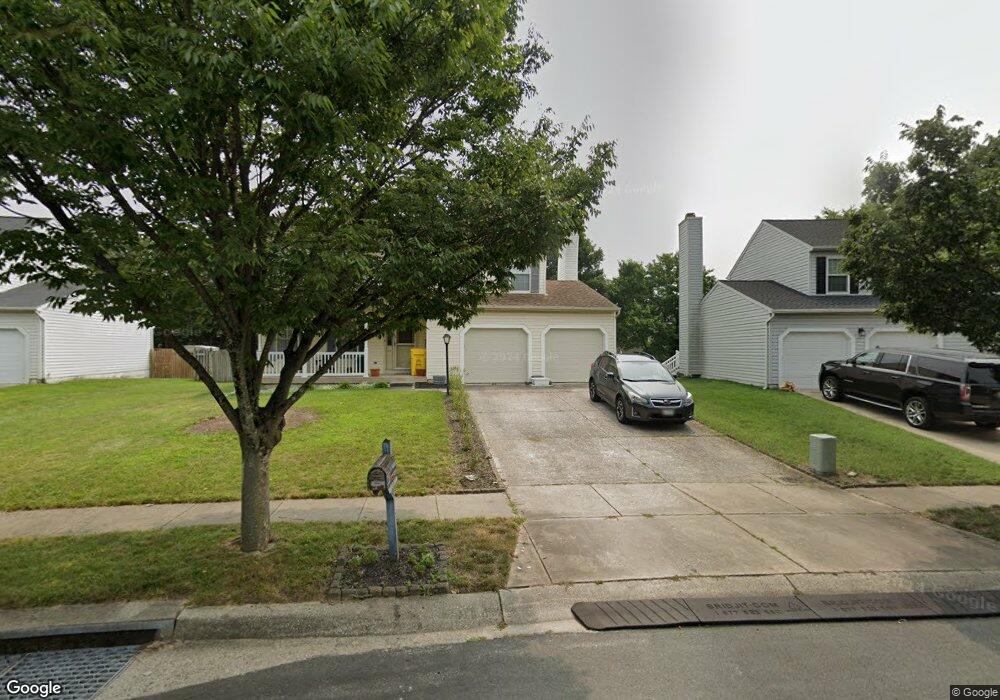
1791 Cruet Ln Severn, MD 21144
Estimated Value: $535,000 - $559,000
--
Bed
3
Baths
1,812
Sq Ft
$305/Sq Ft
Est. Value
About This Home
This home is located at 1791 Cruet Ln, Severn, MD 21144 and is currently estimated at $552,622, approximately $304 per square foot. 1791 Cruet Ln is a home located in Anne Arundel County with nearby schools including Jessup Elementary School, Meade Middle School, and Meade High School.
Ownership History
Date
Name
Owned For
Owner Type
Purchase Details
Closed on
Dec 5, 2018
Sold by
Clarke Margie C and Clarke Wayne D
Bought by
Clarke Wayne D
Current Estimated Value
Home Financials for this Owner
Home Financials are based on the most recent Mortgage that was taken out on this home.
Original Mortgage
$156,500
Outstanding Balance
$99,133
Interest Rate
4.6%
Mortgage Type
New Conventional
Estimated Equity
$453,489
Purchase Details
Closed on
Aug 23, 2001
Sold by
Widup Richard E
Bought by
Clarke Margie C and Clarke Wayne D
Purchase Details
Closed on
Dec 8, 1993
Sold by
Grp Ryland
Bought by
Widup Richard E
Home Financials for this Owner
Home Financials are based on the most recent Mortgage that was taken out on this home.
Original Mortgage
$184,000
Interest Rate
6.78%
Purchase Details
Closed on
Jul 9, 1993
Sold by
Woodbridge Construction Corp
Bought by
Ryland Group Inc
Create a Home Valuation Report for This Property
The Home Valuation Report is an in-depth analysis detailing your home's value as well as a comparison with similar homes in the area
Home Values in the Area
Average Home Value in this Area
Purchase History
| Date | Buyer | Sale Price | Title Company |
|---|---|---|---|
| Clarke Wayne D | -- | None Available | |
| Clarke Margie C | $224,900 | -- | |
| Widup Richard E | $184,000 | -- | |
| Ryland Group Inc | $234,000 | -- |
Source: Public Records
Mortgage History
| Date | Status | Borrower | Loan Amount |
|---|---|---|---|
| Open | Clarke Wayne D | $156,500 | |
| Previous Owner | Widup Richard E | $184,000 | |
| Closed | Clarke Margie C | -- |
Source: Public Records
Tax History Compared to Growth
Tax History
| Year | Tax Paid | Tax Assessment Tax Assessment Total Assessment is a certain percentage of the fair market value that is determined by local assessors to be the total taxable value of land and additions on the property. | Land | Improvement |
|---|---|---|---|---|
| 2025 | $3,806 | $447,600 | $191,700 | $255,900 |
| 2024 | $3,806 | $421,300 | $0 | $0 |
| 2023 | $3,684 | $395,000 | $0 | $0 |
| 2022 | $3,427 | $368,700 | $166,700 | $202,000 |
| 2021 | $6,738 | $362,667 | $0 | $0 |
| 2020 | $3,272 | $356,633 | $0 | $0 |
| 2019 | $3,220 | $350,600 | $145,200 | $205,400 |
| 2018 | $3,502 | $345,333 | $0 | $0 |
| 2017 | $3,008 | $340,067 | $0 | $0 |
| 2016 | -- | $334,800 | $0 | $0 |
| 2015 | -- | $327,367 | $0 | $0 |
| 2014 | -- | $319,933 | $0 | $0 |
Source: Public Records
Map
Nearby Homes
- 1550 Provincial Ln
- 1820 Lasalle Place
- 7911 Red Globe Ct
- 1835 Lasalle Place
- 7716 Sentry Terrace
- 7714 Sentry Terrace
- 7700 W Evanston Ct
- 1610 Taylor Terrace
- 7930 Thrush Meadow Place
- 1628 Stream Valley Overlook
- 1883 Cedar Dr
- 1703 Long Tree Ct
- 7809 Stanley Ln
- 1819 Watch House Cir S
- 1639 Stream Valley Overlook
- 8512 Pine Springs Dr
- 7836 Canter Ct
- 8516 Pine Springs Dr
- 7963 Heather Mist Dr
- 7907 Stonehearth Rd
- 1789 Cruet Ln
- 1793 Cruet Ln
- 1572 Provincial Ln
- 1574 Provincial Ln
- 1570 Provincial Ln
- 1787 Cruet Ln
- 1795 Cruet Ln
- 1576 Provincial Ln
- 1792 Cruet Ln
- 1568 Provincial Ln
- 1790 Cruet Ln
- 1794 Cruet Ln
- 1785 Cruet Ln
- 1789 Lasalle Place
- 1578 Provincial Ln
- 1788 Cruet Ln
- 1797 Cruet Ln
- 1791 Lasalle Place
- 1566 Provincial Ln
- 1786 Cruet Ln