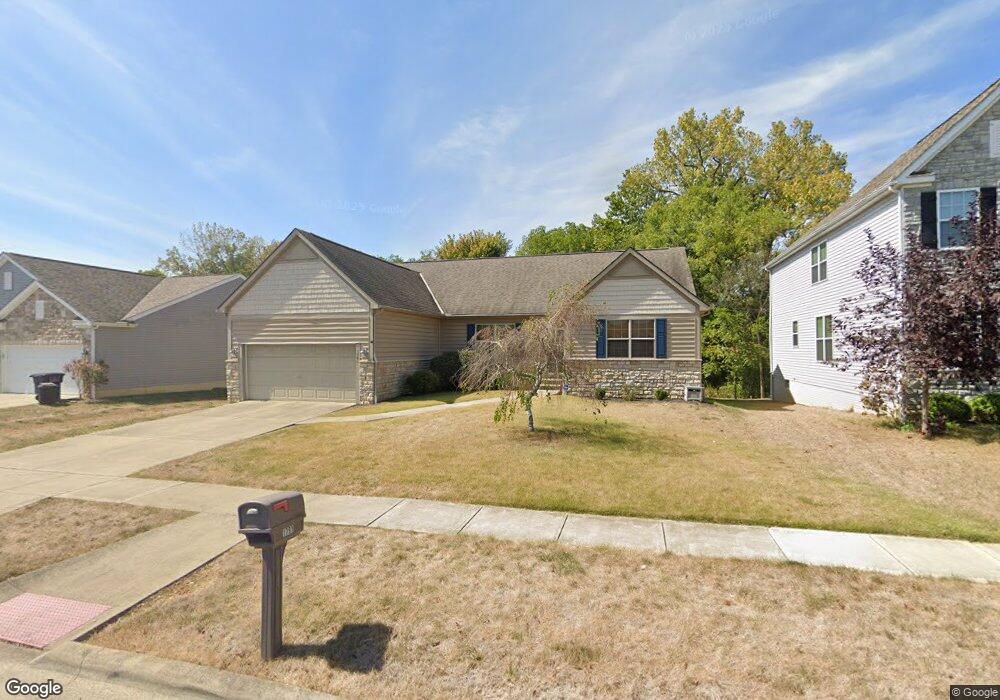
1791 Declaration Dr Lancaster, OH 43130
Estimated Value: $364,961 - $461,000
4
Beds
2
Baths
2,314
Sq Ft
$175/Sq Ft
Est. Value
About This Home
This home is located at 1791 Declaration Dr, Lancaster, OH 43130 and is currently estimated at $405,740, approximately $175 per square foot. 1791 Declaration Dr is a home located in Fairfield County with nearby schools including Thomas Ewing Junior High School, Lancaster High School, and St Bernadette Elementary School.
Ownership History
Date
Name
Owned For
Owner Type
Purchase Details
Closed on
Sep 27, 2016
Sold by
Kohler Daniel
Bought by
Heidi Kohler
Current Estimated Value
Purchase Details
Closed on
Aug 19, 2010
Sold by
Hsbc Bank Usa Na
Bought by
Kohler Daniel and Kohler Heidi
Home Financials for this Owner
Home Financials are based on the most recent Mortgage that was taken out on this home.
Original Mortgage
$162,807
Interest Rate
4.25%
Mortgage Type
FHA
Purchase Details
Closed on
May 26, 2010
Sold by
Dickerson Rodney A and Case #2009 Cv 00478
Bought by
Hsbc Bank Usa Na
Purchase Details
Closed on
Nov 17, 2006
Sold by
Diyanni Brothers Inc
Bought by
Dickerson Rodney A and Steele Dickerson Sonia
Home Financials for this Owner
Home Financials are based on the most recent Mortgage that was taken out on this home.
Original Mortgage
$193,016
Interest Rate
6.12%
Mortgage Type
Purchase Money Mortgage
Purchase Details
Closed on
Dec 13, 2004
Sold by
Dbi Land Co Llc
Bought by
Diyanni Brothers Inc
Create a Home Valuation Report for This Property
The Home Valuation Report is an in-depth analysis detailing your home's value as well as a comparison with similar homes in the area
Home Values in the Area
Average Home Value in this Area
Purchase History
| Date | Buyer | Sale Price | Title Company |
|---|---|---|---|
| Heidi Kohler | -- | -- | |
| Kohler Daniel | $165,000 | None Available | |
| Hsbc Bank Usa Na | $141,000 | None Available | |
| Dickerson Rodney A | $241,300 | Attorney | |
| Diyanni Brothers Inc | -- | Valmerland Title Agency |
Source: Public Records
Mortgage History
| Date | Status | Borrower | Loan Amount |
|---|---|---|---|
| Previous Owner | Kohler Daniel | $162,807 | |
| Previous Owner | Dickerson Rodney A | $193,016 |
Source: Public Records
Tax History
| Year | Tax Paid | Tax Assessment Tax Assessment Total Assessment is a certain percentage of the fair market value that is determined by local assessors to be the total taxable value of land and additions on the property. | Land | Improvement |
|---|---|---|---|---|
| 2025 | $8,184 | $120,750 | $27,230 | $93,520 |
| 2024 | $8,184 | $91,030 | $7,750 | $83,280 |
| 2023 | $3,311 | $91,030 | $7,750 | $83,280 |
| 2022 | $3,324 | $91,030 | $7,750 | $83,280 |
| 2021 | $2,881 | $73,910 | $7,750 | $66,160 |
| 2020 | $2,761 | $73,910 | $7,750 | $66,160 |
| 2019 | $2,625 | $73,910 | $7,750 | $66,160 |
| 2018 | $2,816 | $74,620 | $8,790 | $65,830 |
| 2017 | $2,818 | $75,340 | $6,460 | $68,880 |
| 2016 | $2,744 | $75,340 | $6,460 | $68,880 |
| 2015 | $2,712 | $72,250 | $6,460 | $65,790 |
| 2014 | $2,583 | $72,250 | $6,460 | $65,790 |
| 2013 | $2,583 | $72,250 | $6,460 | $65,790 |
Source: Public Records
Map
Nearby Homes
- 1760 Rainbow Dr NE
- 0 Tiki Ln
- 1804 Pleasantville Rd
- 0 Old Millersport Rd NE Unit 225010386
- 1189 Ridge Rd NE
- 2370 Scenic Dr NE
- 0 Lucille Dr NE
- 1916 Country Place
- 2135 William T Cir
- 2765 Graham Dr NE
- 1434 Pleasantville Rd
- 1286 Stonehill Ln
- 1275 Stonington Ct Unit 1275
- 1306 Shumaker Ave
- 1234 Stonehouse Ct Unit 1234
- 1285 Huffer Ave
- 245 Overlook Dr NE
- 0 Stringtown Rd NW
- 0 Tschopp Rd NE Unit Lot 17 225027320
- 0 Tschopp Rd NE Unit Lot 33 225027324
- 1799 Declaration Dr
- 1783 Declaration Dr
- 0 Declaration Dr W Unit 219001181
- 0 Declaration Dr W Unit 211029423
- 0 Declaration Dr W Unit 211029416
- 0 Declaration Dr W Unit 214048000
- 0 Declaration Dr W Unit 214048207
- 0 Declaration Dr W Unit 214048206
- 0 Declaration Dr W Unit 214048208
- 0 Declaration Dr W Unit 214048204
- 0 Declaration Dr W Unit 214048239
- 0 Declaration Dr W Unit 9922874
- 0 Declaration Dr W Unit 219044169
- 0 Declaration Dr W Unit 9922873
- 0 Declaration Dr W Unit 219044159
- 0 Declaration Dr W Unit Lot 30 212038485
- 0 Declaration Dr W Unit Lot 31 212038483
- 0 Declaration Dr W Unit Lot 6 212038489
- 0 Declaration Dr W
- 1803 Declaration Dr
Your Personal Tour Guide
Ask me questions while you tour the home.