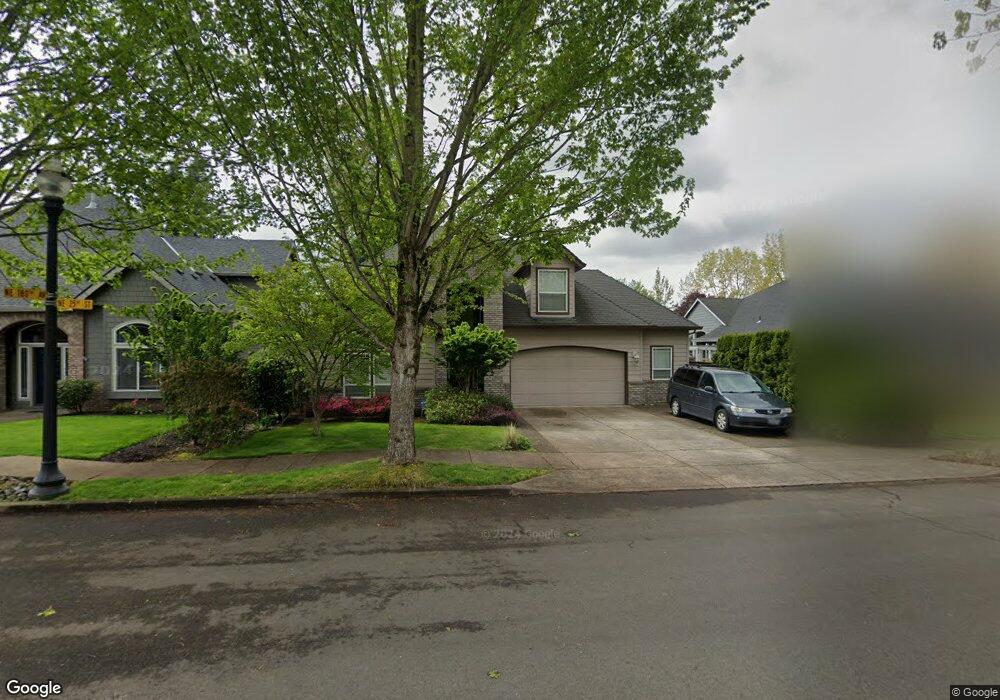
17911 NE 25th St Vancouver, WA 98684
Mill Plain NeighborhoodEstimated Value: $699,000 - $737,000
3
Beds
3
Baths
2,755
Sq Ft
$260/Sq Ft
Est. Value
About This Home
This home is located at 17911 NE 25th St, Vancouver, WA 98684 and is currently estimated at $715,529, approximately $259 per square foot. 17911 NE 25th St is a home located in Clark County with nearby schools including Harmony Elementary School, Pacific Middle School, and Union High School.
Ownership History
Date
Name
Owned For
Owner Type
Purchase Details
Closed on
Apr 2, 2024
Sold by
Valbuena Michael A and Valbuena Karen S
Bought by
Michael A Valbuena And Karen S Valbuena Revoc and Valbuena
Current Estimated Value
Purchase Details
Closed on
Mar 15, 2002
Sold by
Lungu Ivan and Lungu Alena
Bought by
Valbuena Michael A and Valbuena Karen S
Home Financials for this Owner
Home Financials are based on the most recent Mortgage that was taken out on this home.
Original Mortgage
$215,920
Interest Rate
6.85%
Purchase Details
Closed on
Apr 18, 2001
Sold by
Maplecrest Development Llc
Bought by
Lungu Ivan and Lungu Alena
Home Financials for this Owner
Home Financials are based on the most recent Mortgage that was taken out on this home.
Original Mortgage
$152,000
Interest Rate
7.15%
Mortgage Type
Construction
Create a Home Valuation Report for This Property
The Home Valuation Report is an in-depth analysis detailing your home's value as well as a comparison with similar homes in the area
Home Values in the Area
Average Home Value in this Area
Purchase History
| Date | Buyer | Sale Price | Title Company |
|---|---|---|---|
| Michael A Valbuena And Karen S Valbuena Revoc | $313 | None Listed On Document | |
| Valbuena Michael A | $269,900 | Fidelity National Title | |
| Lungu Ivan | $57,500 | First American Title Ins Co |
Source: Public Records
Mortgage History
| Date | Status | Borrower | Loan Amount |
|---|---|---|---|
| Previous Owner | Valbuena Michael A | $215,920 | |
| Previous Owner | Lungu Ivan | $152,000 | |
| Closed | Valbuena Michael A | $26,990 |
Source: Public Records
Tax History Compared to Growth
Tax History
| Year | Tax Paid | Tax Assessment Tax Assessment Total Assessment is a certain percentage of the fair market value that is determined by local assessors to be the total taxable value of land and additions on the property. | Land | Improvement |
|---|---|---|---|---|
| 2025 | $6,547 | $653,986 | $196,840 | $457,146 |
| 2024 | $6,185 | $648,131 | $196,840 | $451,291 |
| 2023 | $6,343 | $641,118 | $202,020 | $439,098 |
| 2022 | $5,495 | $647,699 | $202,020 | $445,679 |
| 2021 | $5,421 | $522,044 | $162,800 | $359,244 |
| 2020 | $5,432 | $484,770 | $148,000 | $336,770 |
| 2019 | $4,999 | $488,017 | $140,800 | $347,217 |
| 2018 | $5,579 | $485,076 | $0 | $0 |
| 2017 | $5,186 | $437,726 | $0 | $0 |
| 2016 | $4,918 | $425,167 | $0 | $0 |
| 2015 | $4,992 | $375,591 | $0 | $0 |
| 2014 | -- | $363,248 | $0 | $0 |
| 2013 | -- | $321,906 | $0 | $0 |
Source: Public Records
Map
Nearby Homes
- 17711 NE 25th St
- 17705 NE 25th St
- 17803 NE 23rd St
- 2204 NE 179th Place
- 2104 NE 180th Place
- 2210 NE 177th Ave
- 2800 NE 184th Ave
- 17301 NE 26th Way
- 17710 NE 31st St
- 18507 NE 28th St
- 3310 NE 181st Ave
- 18203 NE 17th St Unit Lot 1
- 1607 NE 180th Ave Unit Lot 15
- 1605 NE 180th Ave Unit Lot 16
- 1603 NE 180th Ave Unit Lot 17
- Abernathy Plan at Harmony Heights - The Grove Series
- 1506 180th Ave
- Bridlemile Plan at Harmony Heights - The Meadow Series
- Ardenwald Plan at Harmony Heights - The Meadow Series
- 1505 NE 180th Ave
- 18001 NE 25th St
- 17907 NE 25th St
- 18000 NE 24th St
- 18005 NE 25th St
- 17908 NE 24th St
- 18004 NE 24th St
- 18002 NE 25th St
- 18009 NE 25th St
- 18006 NE 25th St
- 17808 NE 24th St
- 18008 NE 24th St
- 18013 NE 25th St
- 18003 NE 26th St
- 17913 NE 24th St
- 17807 NE 25th St
- 18010 NE 25th St
- 17919 NE 24th St
- 18012 NE 24th St
- 17804 NE 24th St
- 18007 NE 26th St