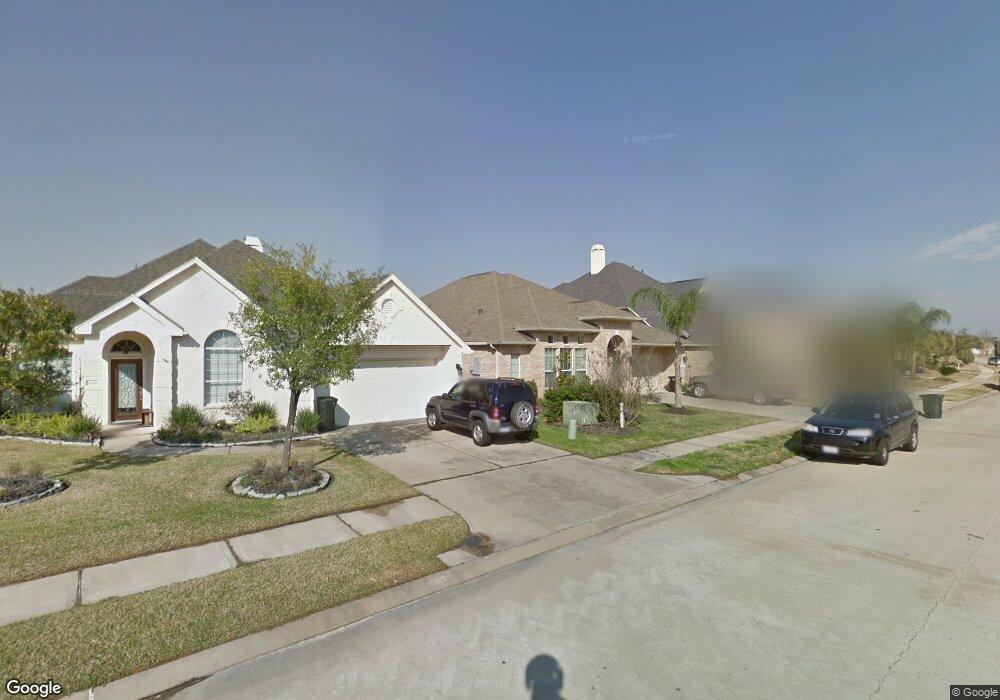
17914 Avalon Point Ct Cypress, TX 77429
Estimated Value: $450,558 - $504,000
3
Beds
3
Baths
2,478
Sq Ft
$195/Sq Ft
Est. Value
About This Home
This home is located at 17914 Avalon Point Ct, Cypress, TX 77429 and is currently estimated at $483,890, approximately $195 per square foot. 17914 Avalon Point Ct is a home located in Harris County with nearby schools including Farney Elementary School, Goodson Middle, and Cypress Woods High School.
Ownership History
Date
Name
Owned For
Owner Type
Purchase Details
Closed on
Jul 18, 2017
Sold by
Bowen Richard and Bowen Heather
Bought by
Yenesew Abunei
Current Estimated Value
Home Financials for this Owner
Home Financials are based on the most recent Mortgage that was taken out on this home.
Original Mortgage
$279,837
Outstanding Balance
$235,501
Interest Rate
4.37%
Mortgage Type
FHA
Estimated Equity
$248,389
Purchase Details
Closed on
Sep 29, 2008
Sold by
Castlerock Communities Lp
Bought by
Bowen Heather and Bowen Richard
Home Financials for this Owner
Home Financials are based on the most recent Mortgage that was taken out on this home.
Original Mortgage
$237,798
Interest Rate
6.52%
Mortgage Type
Purchase Money Mortgage
Purchase Details
Closed on
Sep 7, 2007
Sold by
Sydney Harbour Interests Ltd
Bought by
Castlerock Communities Lp
Create a Home Valuation Report for This Property
The Home Valuation Report is an in-depth analysis detailing your home's value as well as a comparison with similar homes in the area
Home Values in the Area
Average Home Value in this Area
Purchase History
| Date | Buyer | Sale Price | Title Company |
|---|---|---|---|
| Yenesew Abunei | -- | Capital Title | |
| Bowen Heather | -- | Multiple | |
| Castlerock Communities Lp | -- | Crown Title Co Houston |
Source: Public Records
Mortgage History
| Date | Status | Borrower | Loan Amount |
|---|---|---|---|
| Open | Yenesew Abunei | $279,837 | |
| Previous Owner | Bowen Heather | $237,798 |
Source: Public Records
Tax History Compared to Growth
Tax History
| Year | Tax Paid | Tax Assessment Tax Assessment Total Assessment is a certain percentage of the fair market value that is determined by local assessors to be the total taxable value of land and additions on the property. | Land | Improvement |
|---|---|---|---|---|
| 2025 | $7,737 | $466,804 | $86,523 | $380,281 |
| 2024 | $7,737 | $468,791 | $86,523 | $382,268 |
| 2023 | $7,737 | $454,244 | $86,523 | $367,721 |
| 2022 | $9,430 | $418,501 | $75,228 | $343,273 |
| 2021 | $9,145 | $331,224 | $75,228 | $255,996 |
| 2020 | $9,002 | $313,189 | $75,228 | $237,961 |
| 2019 | $9,109 | $305,073 | $75,228 | $229,845 |
| 2018 | $4,332 | $300,806 | $75,228 | $225,578 |
| 2017 | $9,043 | $300,806 | $75,228 | $225,578 |
| 2016 | $9,348 | $310,935 | $59,629 | $251,306 |
| 2015 | $6,730 | $299,189 | $59,629 | $239,560 |
| 2014 | $6,730 | $270,744 | $59,629 | $211,115 |
Source: Public Records
Map
Nearby Homes
- 17922 Harbour Bridge Point Dr
- 17931 Sugarloaf Bay Dr
- 17926 Sugarloaf Bay Dr
- 17910 Cypress Valley Ln
- 18103 Blues Point Dr
- 18103 Double Bay Rd
- 14803 Opera House Row Dr
- 14727 Arbor Trace Ct
- 17631 Huffmeister Rd
- 15011 Magnoliabough Place
- 17515 Cypress Orchard Ln
- 14639 Cypress Cottage Ct
- 14706 Emerald Cypress Ln
- 18306 Juniper Creek Ln
- 17862 Camp Cove Dr
- 14623 Valley Stone Ct
- 18318 Maple Mill Dr
- 14710 Timber Cliff Ln
- 14631 Timber Cliff Ln
- 15430 Elm Leaf Place
- 17918 Avalon Point Ct
- 17910 Avalon Point Ct
- 17922 Avalon Point Ct
- 17906 Avalon Point Ct
- 17926 Avalon Point Ct
- 17902 Avalon Point Ct
- 17919 Avalon Point Ct
- 17915 Avalon Point Ct
- 17923 Avalon Point Ct
- 17915 Harbour Bridge Point Dr
- 17911 Avalon Point Ct
- 17911 Harbour Bridge Point Dr
- 17919 Harbour Bridge Point Dr
- 17927 Avalon Point Ct
- 17834 Avalon Point Ct
- 17907 Avalon Point Ct
- 17930 Avalon Point Ct
- 17907 Harbour Bridge Point Dr
- 17923 Harbour Bridge Point Dr
- 17903 Avalon Point Ct