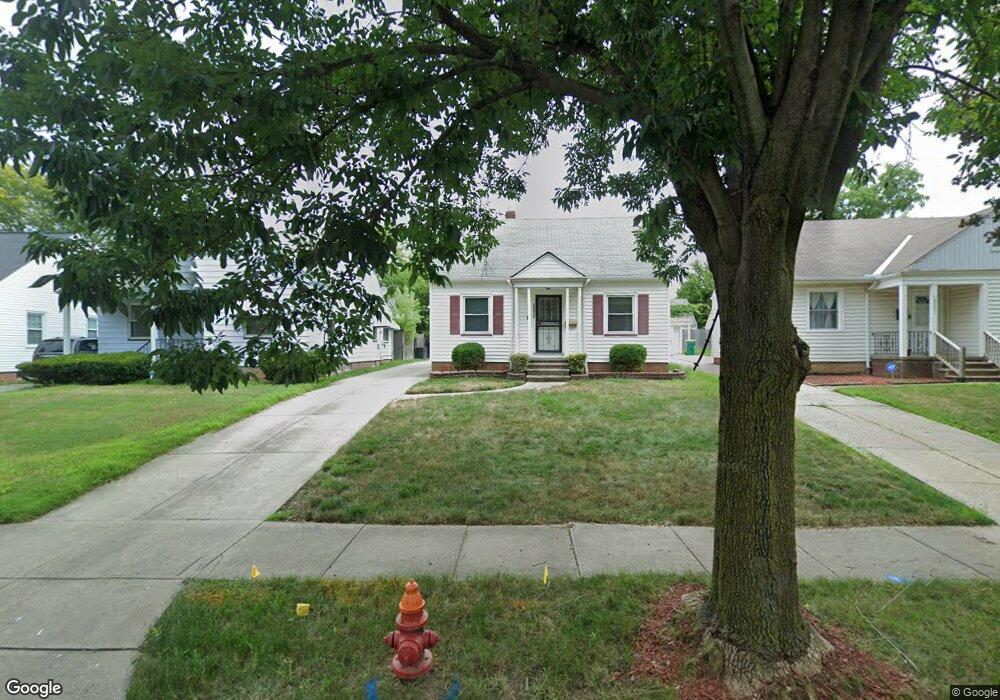
17917 Mapleboro Ave Maple Heights, OH 44137
Estimated Value: $112,873 - $132,000
3
Beds
2
Baths
1,292
Sq Ft
$95/Sq Ft
Est. Value
About This Home
This home is located at 17917 Mapleboro Ave, Maple Heights, OH 44137 and is currently estimated at $123,218, approximately $95 per square foot. 17917 Mapleboro Ave is a home located in Cuyahoga County with nearby schools including Abraham Lincoln Elementary School, Rockside/ J.F. Kennedy School, and Italy High School.
Ownership History
Date
Name
Owned For
Owner Type
Purchase Details
Closed on
Jun 3, 2005
Sold by
Frost Shirley D and Frost Carr Shirley D
Bought by
Frost Shirley D
Current Estimated Value
Home Financials for this Owner
Home Financials are based on the most recent Mortgage that was taken out on this home.
Original Mortgage
$98,600
Outstanding Balance
$51,311
Interest Rate
5.91%
Mortgage Type
New Conventional
Estimated Equity
$71,907
Purchase Details
Closed on
Dec 9, 2002
Sold by
Carr Kenneth
Bought by
Frost Carr Shirley D
Purchase Details
Closed on
May 27, 1994
Sold by
Leposa Michael S
Bought by
Carr Kenneth
Purchase Details
Closed on
Apr 18, 1989
Sold by
Sevier Cindy C
Bought by
Leposa Michael S
Purchase Details
Closed on
Jun 24, 1987
Sold by
Bragg Marie Christine
Bought by
Sevier Cindy C
Purchase Details
Closed on
Jan 1, 1975
Bought by
Bragg Marie Christine
Create a Home Valuation Report for This Property
The Home Valuation Report is an in-depth analysis detailing your home's value as well as a comparison with similar homes in the area
Home Values in the Area
Average Home Value in this Area
Purchase History
| Date | Buyer | Sale Price | Title Company |
|---|---|---|---|
| Frost Shirley D | -- | Cardinal First Title Inc | |
| Frost Carr Shirley D | -- | -- | |
| Carr Kenneth | $67,000 | -- | |
| Leposa Michael S | $54,900 | -- | |
| Sevier Cindy C | -- | -- | |
| Bragg Marie Christine | -- | -- |
Source: Public Records
Mortgage History
| Date | Status | Borrower | Loan Amount |
|---|---|---|---|
| Open | Frost Shirley D | $98,600 |
Source: Public Records
Tax History Compared to Growth
Tax History
| Year | Tax Paid | Tax Assessment Tax Assessment Total Assessment is a certain percentage of the fair market value that is determined by local assessors to be the total taxable value of land and additions on the property. | Land | Improvement |
|---|---|---|---|---|
| 2024 | $3,303 | $36,750 | $6,755 | $29,995 |
| 2023 | $2,797 | $26,920 | $4,800 | $22,120 |
| 2022 | $2,787 | $26,920 | $4,800 | $22,120 |
| 2021 | $2,976 | $26,920 | $4,800 | $22,120 |
| 2020 | $2,533 | $20,410 | $3,640 | $16,770 |
| 2019 | $2,521 | $58,300 | $10,400 | $47,900 |
| 2018 | $2,410 | $20,410 | $3,640 | $16,770 |
| 2017 | $2,489 | $19,780 | $4,760 | $15,020 |
| 2016 | $2,409 | $19,780 | $4,760 | $15,020 |
| 2015 | $2,424 | $19,780 | $4,760 | $15,020 |
| 2014 | $2,424 | $21,740 | $5,220 | $16,520 |
Source: Public Records
Map
Nearby Homes
- 17912 North Blvd
- 17916 North Blvd
- 17806 Maple Heights Blvd
- 5493 Thomas St
- 5425 Grasmere Ave
- 5357 Beechwood Ave
- 17204 Maple Heights Blvd
- 5257 Philip Ave
- 5239 Arch St
- 5234 Erwin St
- 5320 Clement Ave
- 5231 Philip Ave
- 5212 Catherine St
- 5540 Dalewood Ave
- 5409 Hollywood Ave
- 5199 Arch St
- 18909 Maple Heights Blvd
- 5615 South Blvd
- 5562 Dalewood Ave
- 5570 Dalewood Ave
- 18001 Mapleboro Ave
- 17909 Mapleboro Ave
- 18009 Mapleboro Ave
- 17901 Mapleboro Ave
- 18014 Maple Heights Blvd
- 18101 Mapleboro Ave
- 18010 Maple Heights Blvd
- 18018 Maple Heights Blvd
- 17817 Mapleboro Ave
- 18004 Maple Heights Blvd
- 18100 Maple Heights Blvd
- 18105 Mapleboro Ave
- 18000 Maple Heights Blvd
- 17809 Mapleboro Ave
- 18106 Maple Heights Blvd
- 17908 Mapleboro Ave
- 17900 Mapleboro Ave
- 18000 Mapleboro Ave
- 17916 Maple Heights Blvd
- 17816 Mapleboro Ave