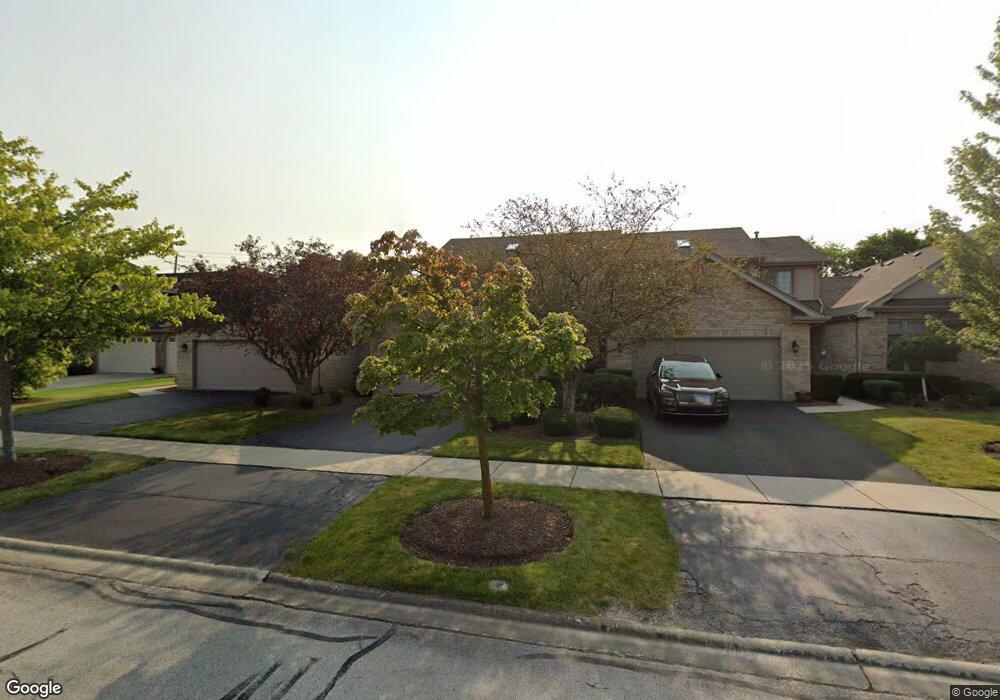
17919 Nielsen Dr Tinley Park, IL 60477
Central Tinley Park NeighborhoodEstimated Value: $341,000 - $401,000
3
Beds
3
Baths
1,796
Sq Ft
$207/Sq Ft
Est. Value
About This Home
This home is located at 17919 Nielsen Dr, Tinley Park, IL 60477 and is currently estimated at $372,306, approximately $207 per square foot. 17919 Nielsen Dr is a home located in Cook County with nearby schools including Millennium Elementary School, Virgil I Grissom Middle School, and Victor J Andrew High School.
Ownership History
Date
Name
Owned For
Owner Type
Purchase Details
Closed on
Nov 12, 2020
Sold by
Amira Ahmed and Gabr Nermin
Bought by
Amira Ahmed and Gabr Nermin
Current Estimated Value
Purchase Details
Closed on
Sep 5, 2006
Sold by
Murray Anthony F and Murray Kathleen
Bought by
Amira Ahmed and Gabr Nermin
Home Financials for this Owner
Home Financials are based on the most recent Mortgage that was taken out on this home.
Original Mortgage
$254,250
Outstanding Balance
$152,020
Interest Rate
6.59%
Mortgage Type
Unknown
Estimated Equity
$220,286
Purchase Details
Closed on
Aug 31, 2000
Sold by
State Bank Of Countryside
Bought by
Murray Anthony F and Murray Kathleen A
Home Financials for this Owner
Home Financials are based on the most recent Mortgage that was taken out on this home.
Original Mortgage
$156,400
Interest Rate
8.15%
Create a Home Valuation Report for This Property
The Home Valuation Report is an in-depth analysis detailing your home's value as well as a comparison with similar homes in the area
Home Values in the Area
Average Home Value in this Area
Purchase History
| Date | Buyer | Sale Price | Title Company |
|---|---|---|---|
| Amira Ahmed | -- | Attorney | |
| Amira Ahmed | $282,500 | Chicago Title Insurance Co | |
| Murray Anthony F | $195,500 | -- |
Source: Public Records
Mortgage History
| Date | Status | Borrower | Loan Amount |
|---|---|---|---|
| Open | Amira Ahmed | $254,250 | |
| Previous Owner | Murray Anthony F | $156,400 |
Source: Public Records
Tax History Compared to Growth
Tax History
| Year | Tax Paid | Tax Assessment Tax Assessment Total Assessment is a certain percentage of the fair market value that is determined by local assessors to be the total taxable value of land and additions on the property. | Land | Improvement |
|---|---|---|---|---|
| 2024 | $6,117 | $28,000 | $3,094 | $24,906 |
| 2023 | $5,523 | $28,000 | $3,094 | $24,906 |
| 2022 | $5,523 | $21,650 | $2,670 | $18,980 |
| 2021 | $5,401 | $21,648 | $2,669 | $18,979 |
| 2020 | $5,399 | $21,648 | $2,669 | $18,979 |
| 2019 | $8,116 | $25,026 | $2,427 | $22,599 |
| 2018 | $7,943 | $25,026 | $2,427 | $22,599 |
| 2017 | $7,731 | $25,026 | $2,427 | $22,599 |
| 2016 | $6,931 | $20,869 | $2,184 | $18,685 |
| 2015 | $6,857 | $20,869 | $2,184 | $18,685 |
| 2014 | $6,798 | $20,869 | $2,184 | $18,685 |
| 2013 | $6,708 | $22,211 | $2,184 | $20,027 |
Source: Public Records
Map
Nearby Homes
- 8036 Blarney Rd
- 7783 Bristol Park Dr Unit 1-SW
- 7767 Bristol Park Dr Unit 7767
- 7755 Bristol Park Dr Unit 1NE
- 7925 Belle Rive Ct
- 8416 Stratford Dr Unit 8416
- 7727 Bristol Park Dr
- 8423 Stratford Dr Unit 8423
- 8313 Aster Ln
- 18261 Kirby Dr Unit 2918261
- 8030 Valley View Dr
- 7517 175th St Unit 331
- 7912 172nd Place
- 17631 Dover Ct
- Fremont Plan at Radcliffe Place
- Calysta Plan at Radcliffe Place
- Danbury Plan at Radcliffe Place
- Briarcliffe Plan at Radcliffe Place
- Eden Plan at Radcliffe Place
- Amberwood Plan at Radcliffe Place
- 17917 Nielsen Dr
- 17907 Nielsen Dr
- 17921 Nielsen Dr
- 17923 Nielsen Dr
- 8000 Mallow Dr
- 17927 Nielsen Dr
- 17929 Nielsen Dr
- 8006 Mallow Dr
- 8013 Mallow Dr
- 8012 Blarney Rd
- 17931 Nielsen Dr
- 8012 Mallow Dr
- 17933 Nielsen Dr
- 8019 Mallow Dr
- 8018 Blarney Rd
- 17937 Nielsen Dr
- 8018 Mallow Dr
- 17939 Nielsen Dr
- 8013 Blarney Rd
- 17941 Nielsen Dr