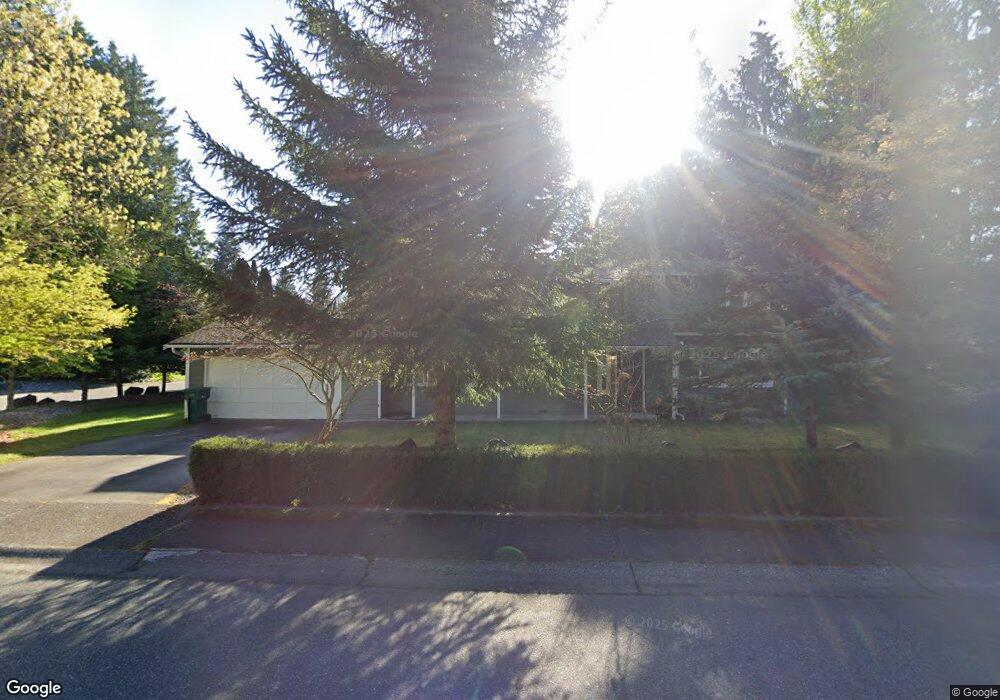
17921 29th Dr SE Bothell, WA 98012
North Creek NeighborhoodEstimated Value: $786,156 - $867,000
3
Beds
2
Baths
1,542
Sq Ft
$535/Sq Ft
Est. Value
About This Home
This home is located at 17921 29th Dr SE, Bothell, WA 98012 and is currently estimated at $824,539, approximately $534 per square foot. 17921 29th Dr SE is a home located in Snohomish County with nearby schools including Cedar Wood Elementary School, Heatherwood Middle School, and Henry M. Jackson High School.
Ownership History
Date
Name
Owned For
Owner Type
Purchase Details
Closed on
Jan 15, 2009
Sold by
Knorr Cheri M
Bought by
Knorr Gregory C and Knorr Cheri M
Current Estimated Value
Home Financials for this Owner
Home Financials are based on the most recent Mortgage that was taken out on this home.
Original Mortgage
$264,000
Outstanding Balance
$165,973
Interest Rate
5.49%
Mortgage Type
Purchase Money Mortgage
Estimated Equity
$658,566
Purchase Details
Closed on
Apr 23, 2003
Sold by
Knorr Gregory C and Knorr Cheri M
Bought by
Knorr Cheri M
Home Financials for this Owner
Home Financials are based on the most recent Mortgage that was taken out on this home.
Original Mortgage
$179,500
Interest Rate
5.54%
Purchase Details
Closed on
Oct 15, 1999
Sold by
Thomas Gregory H
Bought by
Knorr Gregory C and Knorr Cheri M
Home Financials for this Owner
Home Financials are based on the most recent Mortgage that was taken out on this home.
Original Mortgage
$151,300
Interest Rate
7.86%
Mortgage Type
Balloon
Create a Home Valuation Report for This Property
The Home Valuation Report is an in-depth analysis detailing your home's value as well as a comparison with similar homes in the area
Home Values in the Area
Average Home Value in this Area
Purchase History
| Date | Buyer | Sale Price | Title Company |
|---|---|---|---|
| Knorr Gregory C | $112,359 | Commonwealth Land Title | |
| Knorr Cheri M | -- | Chicago | |
| Knorr Gregory C | $178,000 | First American Title Ins Co |
Source: Public Records
Mortgage History
| Date | Status | Borrower | Loan Amount |
|---|---|---|---|
| Open | Knorr Gregory C | $264,000 | |
| Closed | Knorr Cheri M | $179,500 | |
| Closed | Knorr Gregory C | $151,300 |
Source: Public Records
Tax History
| Year | Tax Paid | Tax Assessment Tax Assessment Total Assessment is a certain percentage of the fair market value that is determined by local assessors to be the total taxable value of land and additions on the property. | Land | Improvement |
|---|---|---|---|---|
| 2026 | $6,811 | $742,900 | $504,000 | $238,900 |
| 2025 | $6,299 | $703,400 | $514,500 | $188,900 |
| 2024 | $6,299 | $653,000 | $470,400 | $182,600 |
| 2023 | $6,415 | $729,200 | $538,400 | $190,800 |
| 2022 | $5,309 | $521,300 | $357,900 | $163,400 |
| 2020 | $5,118 | $422,400 | $278,400 | $144,000 |
| 2019 | $5,187 | $430,100 | $261,300 | $168,800 |
| 2018 | $5,170 | $390,700 | $223,300 | $167,400 |
| 2017 | $4,514 | $343,000 | $185,300 | $157,700 |
| 2016 | $3,926 | $312,900 | $161,500 | $151,400 |
| 2015 | $3,993 | $302,000 | $160,600 | $141,400 |
| 2013 | $3,521 | $235,200 | $117,800 | $117,400 |
Source: Public Records
Map
Nearby Homes
- 3205 179th Place SE
- 18223 31st Ave SE
- 3028 183rd Place SE
- 18309 26th Dr SE
- 18115 34th Dr SE
- 18501 28th Ave SE
- 3414 176th Place SE
- 18632 29th Ave SE
- 2401 185th Place SE
- 17529 Brook Blvd
- 17913 38th Dr SE Unit 20
- 18429 20th Dr SE
- 17001 31st Dr SE
- 18725 35th Dr SE
- 17116 35th Dr SE Unit C6
- 17116 35th Dr SE Unit C2
- 17116 35th Dr SE Unit A2
- 3918 177th St SE
- 3933 178th Place SE
- 3413 189th Place SE
- 2930 179th St SE
- 3006 179th St SE
- 17924 29th Dr SE
- 17916 29th Dr SE
- 17833 29th Dr SE
- 17908 29th Dr SE
- 3003 179th St SE
- 2911 180th Place SE
- 2915 180th Place SE
- 18004 29th Dr SE
- 2919 180th Place SE
- 2923 180th Place SE
- 2929 180th Place SE
- 3012 179th St SE
- 18006 29th Dr SE
- 17830 29th Dr SE
- 17827 29th Dr SE
- 3009 179th St SE
- 17915 28th Ave SE
- 18008 29th Dr SE
Your Personal Tour Guide
Ask me questions while you tour the home.