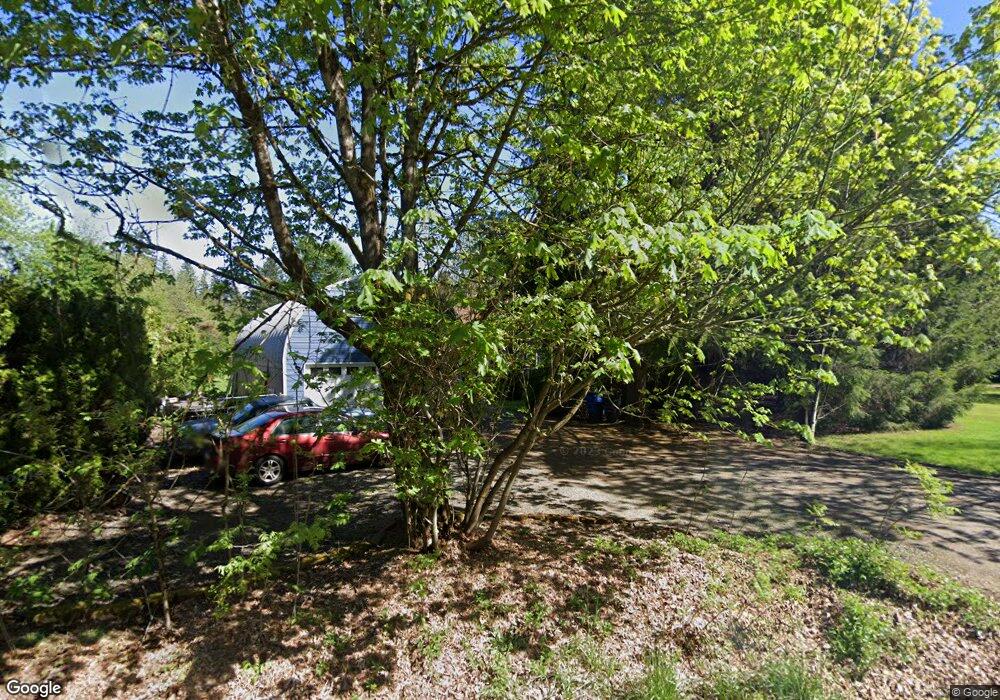
17921 NE Cramer Rd Battle Ground, WA 98604
Estimated Value: $654,786 - $842,000
4
Beds
2
Baths
2,136
Sq Ft
$344/Sq Ft
Est. Value
About This Home
This home is located at 17921 NE Cramer Rd, Battle Ground, WA 98604 and is currently estimated at $734,447, approximately $343 per square foot. 17921 NE Cramer Rd is a home located in Clark County with nearby schools including Maple Grove Primary School, Prairie High School, and Firm Foundation Christian School.
Ownership History
Date
Name
Owned For
Owner Type
Purchase Details
Closed on
Mar 21, 2002
Sold by
Hair Michael J and Hair Patricia L
Bought by
Mason James and Mason Marie
Current Estimated Value
Home Financials for this Owner
Home Financials are based on the most recent Mortgage that was taken out on this home.
Original Mortgage
$156,000
Outstanding Balance
$64,156
Interest Rate
6.84%
Estimated Equity
$670,291
Purchase Details
Closed on
Feb 12, 1998
Sold by
Holbrook Paul M and Holbrook Lisa L
Bought by
Hair Michael J and Hair Patricia L
Home Financials for this Owner
Home Financials are based on the most recent Mortgage that was taken out on this home.
Original Mortgage
$159,120
Interest Rate
6.97%
Mortgage Type
VA
Purchase Details
Closed on
Sep 17, 1996
Sold by
Groat Donald L and Johnson Groat Carolyn A
Bought by
Holbrook Paul M and Holbrook Lisa L
Home Financials for this Owner
Home Financials are based on the most recent Mortgage that was taken out on this home.
Original Mortgage
$103,600
Interest Rate
7.88%
Mortgage Type
Balloon
Create a Home Valuation Report for This Property
The Home Valuation Report is an in-depth analysis detailing your home's value as well as a comparison with similar homes in the area
Home Values in the Area
Average Home Value in this Area
Purchase History
| Date | Buyer | Sale Price | Title Company |
|---|---|---|---|
| Mason James | $195,000 | First American Title Ins Co | |
| Hair Michael J | $156,000 | Chicago Title Insurance Co | |
| Holbrook Paul M | $150,660 | Clark County Title Company |
Source: Public Records
Mortgage History
| Date | Status | Borrower | Loan Amount |
|---|---|---|---|
| Open | Mason James | $156,000 | |
| Previous Owner | Hair Michael J | $159,120 | |
| Previous Owner | Holbrook Paul M | $103,600 |
Source: Public Records
Tax History Compared to Growth
Tax History
| Year | Tax Paid | Tax Assessment Tax Assessment Total Assessment is a certain percentage of the fair market value that is determined by local assessors to be the total taxable value of land and additions on the property. | Land | Improvement |
|---|---|---|---|---|
| 2025 | $5,532 | $666,911 | $255,000 | $411,911 |
| 2024 | $4,902 | $631,821 | $255,000 | $376,821 |
| 2023 | $5,283 | $627,901 | $255,000 | $372,901 |
| 2022 | $4,802 | $619,667 | $274,150 | $345,517 |
| 2021 | $4,636 | $522,855 | $224,750 | $298,105 |
| 2020 | $2,272 | $460,488 | $210,500 | $249,988 |
| 2019 | $3,898 | $442,608 | $192,450 | $250,158 |
| 2018 | $4,522 | $434,921 | $0 | $0 |
| 2017 | $3,987 | $385,679 | $0 | $0 |
| 2016 | $3,774 | $369,459 | $0 | $0 |
| 2015 | $3,660 | $322,212 | $0 | $0 |
| 2014 | -- | $297,646 | $0 | $0 |
| 2013 | -- | $282,806 | $0 | $0 |
Source: Public Records
Map
Nearby Homes
- 18001 NE 110th Ave
- 4102 NE 187th St Unit LOT 289
- 9307 NE 179th St
- 11201 NE 182nd St
- 18004 NE 113th Ave
- 10704 NE 189th St
- 8805 NE 179th St
- 11700 NE 185th St
- 10400 NE 197th St
- 1707 SW 25th Cir
- 8008 NE 179th St Unit 23
- 20204 NE 104th Ave
- Glenwood Plan at Woodin Creek Station
- Turquoise Plan at Woodin Creek Station
- Laurel Plan at Woodin Creek Station
- Dahlia Plan at Woodin Creek Station - Townhomes
- Nettle Plan at Woodin Creek Station - Townhomes
- Bramble Plan at Woodin Creek Station - Townhomes
- Oakridge Plan at Woodin Creek Station
- Riverbend Plan at Woodin Creek Station
- 10303 NE 179th St
- 10105 NE 180th Cir
- 17909 NE Cramer Rd
- 0 NE 102nd Ave Unit 19399022
- 0 NE 102nd Ave Unit 10085625
- 0 NE 102nd Ave Unit 7 17647127
- 0 NE 102nd Ave Unit 3 17616231
- 0 NE 102nd Ave Unit 5 17503900
- 0 NE 102nd Ave Unit 4 17417347
- 0 NE 102nd Ave Unit Lot 2 17308466
- 0 NE 102nd Ave Unit 6 17059354
- 0 NE 102nd Ave Unit Lot 1 17691437
- 0 NE 102nd Ave
- 10206 NE 178th Cir
- 18017 NE Cramer Rd
- 10405 NE 179th St
- 10107 NE 180th Cir
- 10405 NE 179th Cir
- 10103 NE 180th Cir