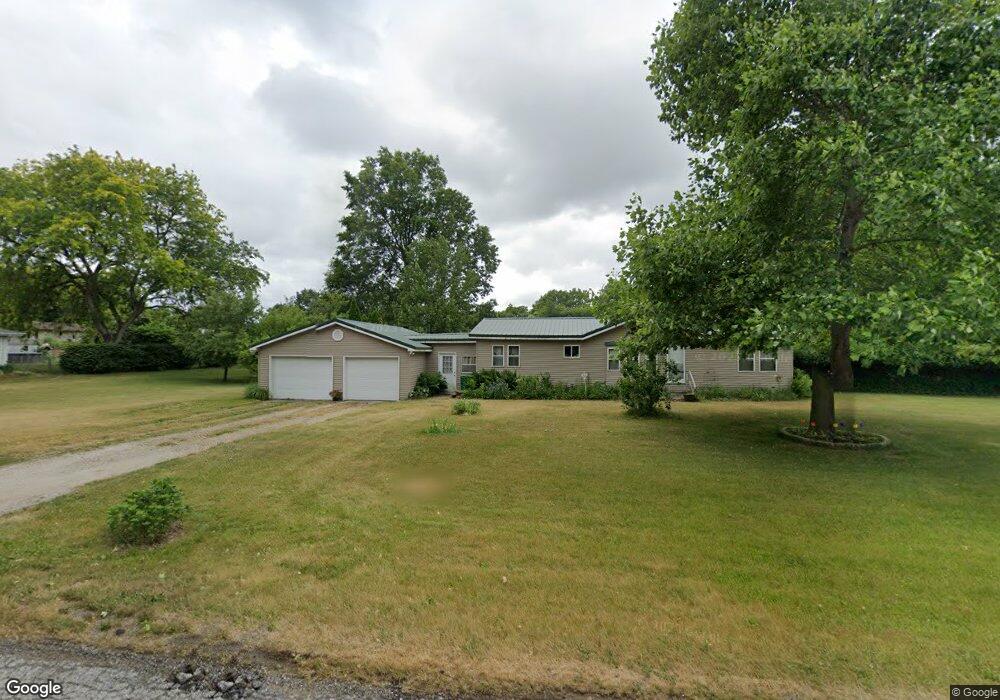
17929 Main St Tyner, IN 46572
Estimated Value: $114,000 - $294,000
3
Beds
2
Baths
1,344
Sq Ft
$146/Sq Ft
Est. Value
About This Home
This home is located at 17929 Main St, Tyner, IN 46572 and is currently estimated at $195,933, approximately $145 per square foot. 17929 Main St is a home located in Marshall County with nearby schools including John Glenn High School.
Ownership History
Date
Name
Owned For
Owner Type
Purchase Details
Closed on
May 5, 2010
Sold by
Federal Home Loan Mortgage Corporation
Bought by
Hibner Sandra R
Current Estimated Value
Home Financials for this Owner
Home Financials are based on the most recent Mortgage that was taken out on this home.
Original Mortgage
$39,275
Interest Rate
5.5%
Mortgage Type
FHA
Purchase Details
Closed on
Jan 11, 2010
Sold by
Davis Carol A
Bought by
Federal Home Loan Mortgage Corporation
Purchase Details
Closed on
Dec 22, 2009
Sold by
Vanvactor Sheriff Jon E
Bought by
Federal Home Loan Mortgage Corp
Purchase Details
Closed on
Oct 28, 2005
Sold by
Nimon Michael D
Bought by
Davis Carol A
Home Financials for this Owner
Home Financials are based on the most recent Mortgage that was taken out on this home.
Original Mortgage
$80,100
Interest Rate
6.17%
Mortgage Type
New Conventional
Purchase Details
Closed on
Jun 14, 2000
Sold by
Dipert Lewis W
Bought by
Nimon Michael D
Create a Home Valuation Report for This Property
The Home Valuation Report is an in-depth analysis detailing your home's value as well as a comparison with similar homes in the area
Home Values in the Area
Average Home Value in this Area
Purchase History
| Date | Buyer | Sale Price | Title Company |
|---|---|---|---|
| Hibner Sandra R | -- | None Available | |
| Federal Home Loan Mortgage Corporation | -- | None Available | |
| Federal Home Loan Mortgage Corp | -- | Feiwell & Hannoy | |
| Davis Carol A | -- | Landamerica Lawyers Title | |
| Nimon Michael D | $66,000 | -- |
Source: Public Records
Mortgage History
| Date | Status | Borrower | Loan Amount |
|---|---|---|---|
| Closed | Hibner Sandra R | $39,275 | |
| Previous Owner | Davis Carol A | $80,100 |
Source: Public Records
Tax History Compared to Growth
Tax History
| Year | Tax Paid | Tax Assessment Tax Assessment Total Assessment is a certain percentage of the fair market value that is determined by local assessors to be the total taxable value of land and additions on the property. | Land | Improvement |
|---|---|---|---|---|
| 2024 | $871 | $138,500 | $45,000 | $93,500 |
| 2022 | $871 | $135,000 | $34,600 | $100,400 |
| 2021 | $769 | $114,700 | $28,800 | $85,900 |
| 2020 | $630 | $104,500 | $26,200 | $78,300 |
| 2019 | $580 | $100,700 | $25,200 | $75,500 |
| 2018 | $575 | $97,700 | $24,500 | $73,200 |
| 2017 | $491 | $94,200 | $23,800 | $70,400 |
| 2016 | $452 | $94,200 | $23,800 | $70,400 |
| 2014 | $466 | $96,700 | $24,300 | $72,400 |
Source: Public Records
Map
Nearby Homes
- 4168 N Sycamore Rd
- 17580 Vine St
- 5099 Sage Rd
- 4632 Queen Rd
- 19203 6th Rd
- 3741 N Thorn Rd
- 20782 S Lake Dr
- TBD 3b Rd
- TBD S Lake Dr
- 00 S Lake Dr
- 20906 S Lake Dr
- 20973 N Lake Dr
- 11985 E South St
- 1461 N Queen Rd
- 7640 Union Rd
- 19547 Lincoln Hwy
- 8170 N Tippecanoe Dr
- 8875 N 1150 E
- 7891 N Tippecanoe Dr
- TBD Beech Ave