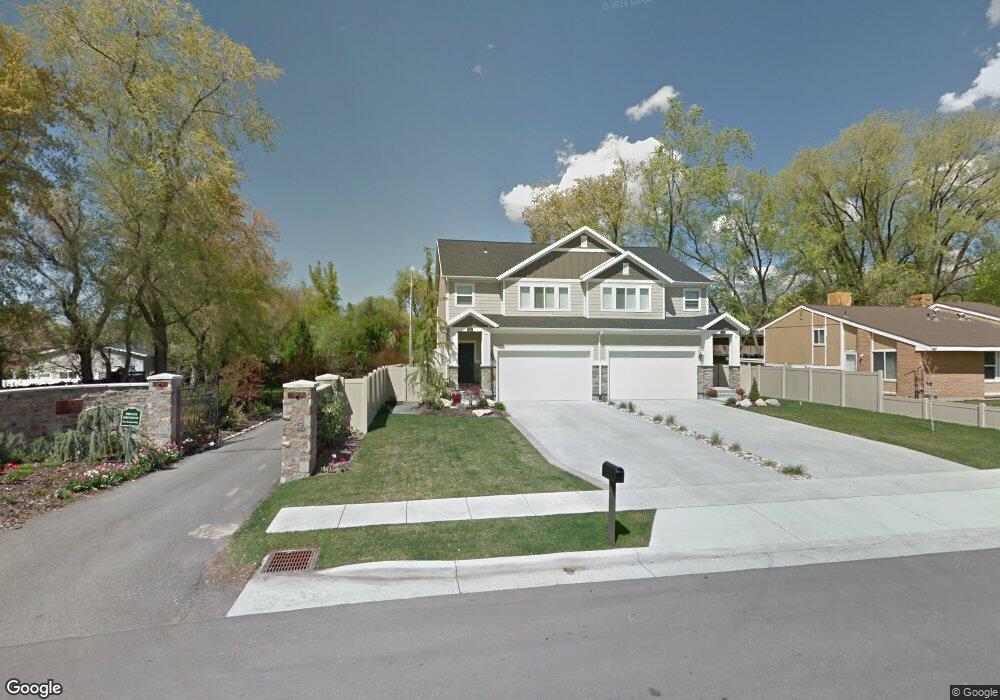
1793 E Vine St Murray, UT 84121
Estimated Value: $391,000 - $546,000
4
Beds
4
Baths
2,578
Sq Ft
$182/Sq Ft
Est. Value
About This Home
This home is located at 1793 E Vine St, Murray, UT 84121 and is currently estimated at $468,415, approximately $181 per square foot. 1793 E Vine St is a home located in Salt Lake County with nearby schools including Oakwood Elementary School, Bonneville Junior High School, and Cottonwood High School.
Ownership History
Date
Name
Owned For
Owner Type
Purchase Details
Closed on
Sep 25, 2017
Sold by
Ledoux Mark and Ledoux Dorothy
Bought by
Ledoux Mark and Ledoux Dorothy
Current Estimated Value
Purchase Details
Closed on
Jun 15, 2017
Sold by
Woodard Daniel
Bought by
Ledoux Mark and Ledoux Dorothy
Home Financials for this Owner
Home Financials are based on the most recent Mortgage that was taken out on this home.
Original Mortgage
$297,750
Outstanding Balance
$202,851
Interest Rate
4.02%
Mortgage Type
New Conventional
Estimated Equity
$265,564
Purchase Details
Closed on
Jan 31, 2017
Sold by
Anderson Alyssa
Bought by
Woodward Daniel
Purchase Details
Closed on
Apr 9, 2015
Sold by
Hartford Law Associates Llc
Bought by
Woodard Daniel
Home Financials for this Owner
Home Financials are based on the most recent Mortgage that was taken out on this home.
Original Mortgage
$244,500
Interest Rate
3.8%
Mortgage Type
New Conventional
Create a Home Valuation Report for This Property
The Home Valuation Report is an in-depth analysis detailing your home's value as well as a comparison with similar homes in the area
Home Values in the Area
Average Home Value in this Area
Purchase History
| Date | Buyer | Sale Price | Title Company |
|---|---|---|---|
| Ledoux Mark | -- | None Available | |
| Ledoux Mark | -- | First American Title Ins Co | |
| Woodward Daniel | -- | None Available | |
| Woodard Daniel | -- | First American Title | |
| Woodward Daniel | -- | First American Title Company |
Source: Public Records
Mortgage History
| Date | Status | Borrower | Loan Amount |
|---|---|---|---|
| Open | Ledoux Mark | $297,750 | |
| Previous Owner | Woodward Daniel | $244,500 |
Source: Public Records
Tax History
| Year | Tax Paid | Tax Assessment Tax Assessment Total Assessment is a certain percentage of the fair market value that is determined by local assessors to be the total taxable value of land and additions on the property. | Land | Improvement |
|---|---|---|---|---|
| 2025 | $1,854 | $338,000 | $101,400 | $236,600 |
| 2024 | $1,854 | $338,800 | $101,600 | $237,200 |
| 2023 | $1,918 | $337,100 | $101,100 | $236,000 |
| 2022 | $1,930 | $341,400 | $102,400 | $239,000 |
| 2021 | $1,765 | $343,700 | $103,100 | $240,600 |
| 2020 | $2,325 | $344,500 | $103,300 | $241,200 |
| 2019 | $2,555 | $368,400 | $110,500 | $257,900 |
| 2016 | $2,207 | $345,000 | $103,500 | $241,500 |
Source: Public Records
Map
Nearby Homes
- 1801 E Norma Cir
- 1694 E Cannes Way
- 6044 S Fontaine Bleu Dr
- 6245 S Steeple Chase Ln
- 6301 S Madrid St Unit C22
- 6385 S 1765 E
- 5946 S Highland Dr
- 1932 E Charleston Ln
- 6415 S Tanner Ln
- 6414 S 1680 E
- 6410 S 1650 E
- 5795 S Minden Dr
- 6048 S 2075 E
- 6066 S 2075 E
- 6056 S 2075 E
- 5832 S Waterbury Way Unit J
- 6439 S 1940 E
- 1706 E 6485 S
- 1581 E 6470 S
- 6150 Murdoch Woods Place
- 1797 E Vine St
- 1765 Vine St Unit 1775
- 1785 Vine St
- 1807 Vine St Unit 1809
- 1807 E Vine St
- 1753 E Vine St
- 1751 E Vine St
- 1804 Norma Cir Unit 1806
- 1753 Vine St
- 1800 Norma Cir Unit 1802
- 1848 E Vine St
- 1817 E Vine St
- 1815 Vine St Unit 1817
- 6116 Carriage Park Cir
- 1815 E Vine St
- 1815 E Vine St Unit 1817
- 6116 S Carriage Park Cir
- 1776 E Vine St
- 1814 S Norma Cir
- 1770 Vine St
Your Personal Tour Guide
Ask me questions while you tour the home.