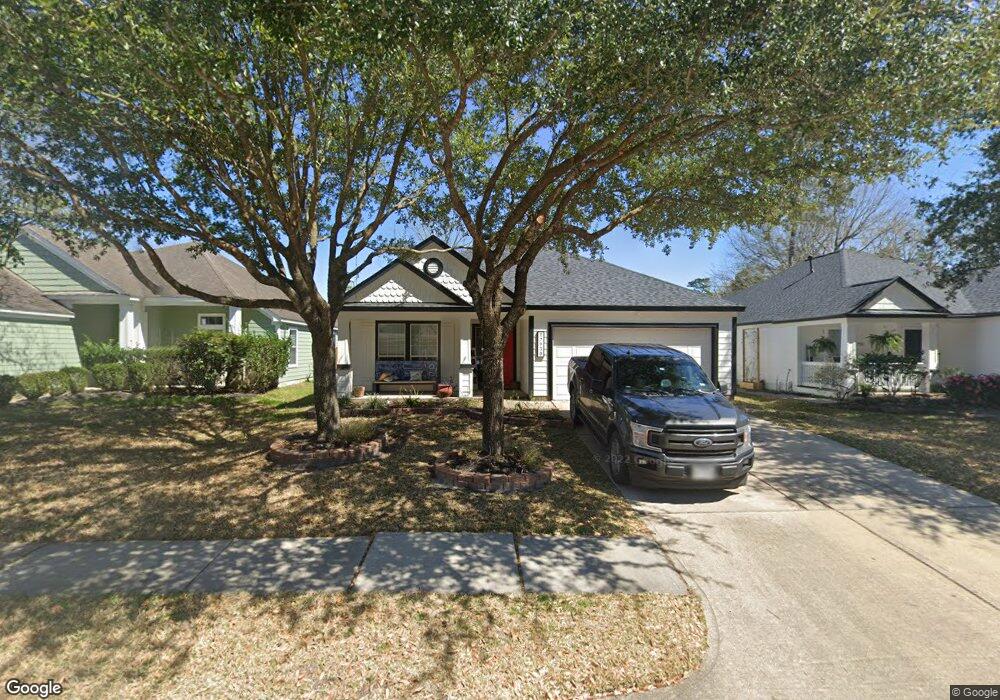
17930 Diamond Peak Ct Humble, TX 77346
Estimated Value: $257,099 - $274,000
3
Beds
4
Baths
1,615
Sq Ft
$165/Sq Ft
Est. Value
About This Home
This home is located at 17930 Diamond Peak Ct, Humble, TX 77346 and is currently estimated at $266,525, approximately $165 per square foot. 17930 Diamond Peak Ct is a home located in Harris County with nearby schools including Eagle Springs Elementary School, Timberwood Middle School, and Atascocita High School.
Ownership History
Date
Name
Owned For
Owner Type
Purchase Details
Closed on
Aug 11, 2015
Sold by
Brodd Matthew L and Brodd Teletha
Bought by
Mary Robert and Mary Becky
Current Estimated Value
Home Financials for this Owner
Home Financials are based on the most recent Mortgage that was taken out on this home.
Original Mortgage
$167,892
Outstanding Balance
$132,493
Interest Rate
4.13%
Mortgage Type
FHA
Estimated Equity
$134,032
Purchase Details
Closed on
Jun 1, 2010
Sold by
Rosin Kelly and Rosin Mark
Bought by
Brodd Matthew L
Home Financials for this Owner
Home Financials are based on the most recent Mortgage that was taken out on this home.
Original Mortgage
$135,990
Interest Rate
4.75%
Mortgage Type
FHA
Purchase Details
Closed on
Sep 23, 2004
Sold by
Perry Homes
Bought by
Farmer Kelly
Home Financials for this Owner
Home Financials are based on the most recent Mortgage that was taken out on this home.
Original Mortgage
$121,089
Interest Rate
5.81%
Mortgage Type
Purchase Money Mortgage
Create a Home Valuation Report for This Property
The Home Valuation Report is an in-depth analysis detailing your home's value as well as a comparison with similar homes in the area
Home Values in the Area
Average Home Value in this Area
Purchase History
| Date | Buyer | Sale Price | Title Company |
|---|---|---|---|
| Mary Robert | -- | Capital Title | |
| Brodd Matthew L | -- | Etc | |
| Farmer Kelly | -- | Chicago Title |
Source: Public Records
Mortgage History
| Date | Status | Borrower | Loan Amount |
|---|---|---|---|
| Open | Mary Robert | $167,892 | |
| Previous Owner | Brodd Matthew L | $135,990 | |
| Previous Owner | Farmer Kelly | $121,089 |
Source: Public Records
Tax History Compared to Growth
Tax History
| Year | Tax Paid | Tax Assessment Tax Assessment Total Assessment is a certain percentage of the fair market value that is determined by local assessors to be the total taxable value of land and additions on the property. | Land | Improvement |
|---|---|---|---|---|
| 2025 | $5,373 | $267,507 | $71,531 | $195,976 |
| 2024 | $5,373 | $259,784 | $47,688 | $212,096 |
| 2023 | $5,373 | $255,637 | $47,688 | $207,949 |
| 2022 | $6,033 | $234,502 | $47,688 | $186,814 |
| 2021 | $5,785 | $194,601 | $47,688 | $146,913 |
| 2020 | $5,773 | $185,769 | $47,688 | $138,081 |
| 2019 | $5,608 | $172,943 | $27,300 | $145,643 |
| 2018 | $2,122 | $164,619 | $27,300 | $137,319 |
| 2017 | $5,289 | $164,619 | $27,300 | $137,319 |
| 2016 | $5,289 | $164,619 | $27,300 | $137,319 |
| 2015 | $4,575 | $159,362 | $27,300 | $132,062 |
| 2014 | $4,575 | $140,597 | $27,300 | $113,297 |
Source: Public Records
Map
Nearby Homes
- 17918 Eagle Pass Falls Ct
- 12730 Rock Creek Ct
- 12911 Long Hunter Ct
- 12706 Rock Creek Ct
- 18131 Stone Trail Manor Dr
- 17703 Indian Mountain Ln
- 18102 Pagemill Point Ln
- 6714 Carrington Ridge Ln
- 18063 Crescent Royale Way
- 12527 Cape Sable Ct
- 18207 Red Eagle Ct
- 12242 Valley Lodge Pkwy
- 12811 Spirit Mound Ln
- 12433 Tyler Springs Ln
- 18434 Yellowstone Trail
- 7002 Winter Blossom Dr
- 18423 Yellowstone Trail
- 13027 Freemont Peak Ln
- 12530 Fern Creek Trail
- 18511 Yellowstone Trail
- 17934 Diamond Peak Ct
- 17926 Diamond Peak Ct
- 17938 Diamond Peak Ct
- 17922 Diamond Peak Ct
- 12731 Whistling Springs Dr
- 12723 Whistling Springs Dr
- 17942 Diamond Peak Ct
- 17931 Diamond Peak Ct
- 12739 Whistling Springs Dr
- 17927 Diamond Peak Ct
- 12719 Whistling Springs Dr
- 17914 Diamond Peak Ct
- 17923 Diamond Peak Ct
- 12743 Whistling Springs Dr
- 0 Diamond Peak Ct Unit 96552041
- 17946 Diamond Peak Ct
- 12715 Whistling Springs Dr
- 17939 Diamond Peak Ct
- 17919 Diamond Peak Ct
- 17910 Diamond Peak Ct