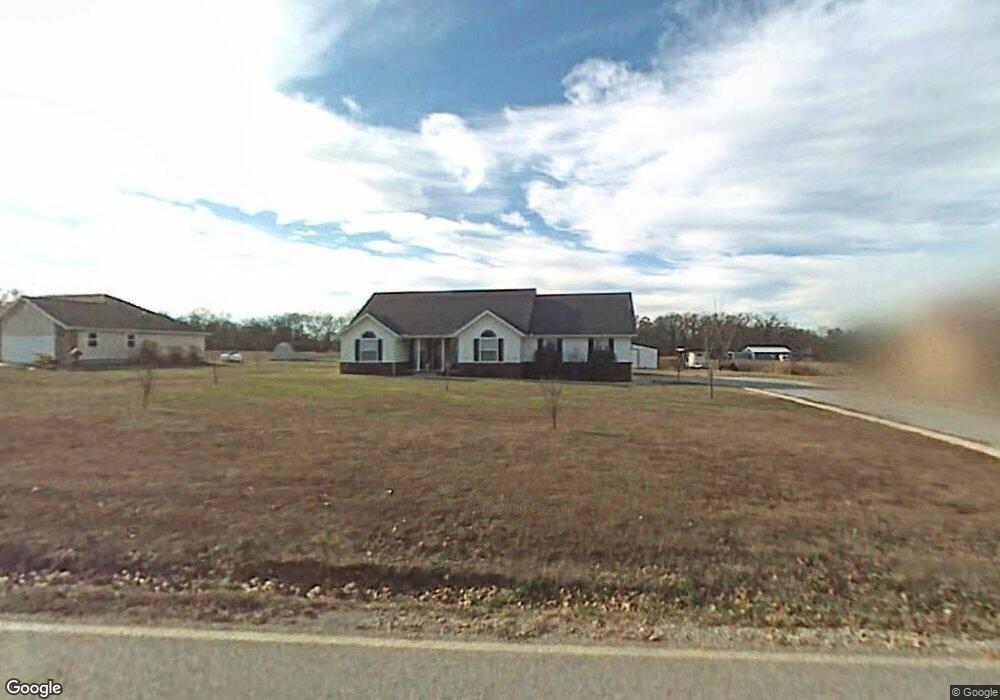
17933 Fisher Ford Rd Siloam Springs, AR 72761
Estimated Value: $342,000 - $609,000
4
Beds
2
Baths
1,742
Sq Ft
$259/Sq Ft
Est. Value
About This Home
This home is located at 17933 Fisher Ford Rd, Siloam Springs, AR 72761 and is currently estimated at $450,848, approximately $258 per square foot. 17933 Fisher Ford Rd is a home located in Benton County with nearby schools including Northside Elementary School, Southside Elementary School, and Delbert Pete & Pat Allen Elementary School.
Ownership History
Date
Name
Owned For
Owner Type
Purchase Details
Closed on
Nov 19, 2009
Sold by
Mcbride Gerald Chris and Mcbride Kristy Jolene
Bought by
Cook David R and Cook Stacey R
Current Estimated Value
Home Financials for this Owner
Home Financials are based on the most recent Mortgage that was taken out on this home.
Original Mortgage
$188,030
Outstanding Balance
$122,713
Interest Rate
4.99%
Mortgage Type
FHA
Estimated Equity
$328,135
Purchase Details
Closed on
Dec 18, 2001
Bought by
Mcbride
Purchase Details
Closed on
Jun 28, 2001
Bought by
Mcbride
Purchase Details
Closed on
Feb 9, 2000
Bought by
Mitchell Mitchell 1 and Mitchell 32A
Purchase Details
Closed on
Mar 1, 1999
Bought by
Gibe 2P
Purchase Details
Closed on
Dec 3, 1997
Bought by
Msw Prop 2P
Purchase Details
Closed on
Feb 17, 1993
Bought by
Msw Prop
Purchase Details
Closed on
Jun 8, 1989
Bought by
Prince
Purchase Details
Closed on
May 1, 1986
Bought by
Welch
Create a Home Valuation Report for This Property
The Home Valuation Report is an in-depth analysis detailing your home's value as well as a comparison with similar homes in the area
Home Values in the Area
Average Home Value in this Area
Purchase History
| Date | Buyer | Sale Price | Title Company |
|---|---|---|---|
| Cook David R | $192,000 | Waco Title Company | |
| Mcbride | -- | -- | |
| Mcbride | -- | -- | |
| Mitchell Mitchell 1 | -- | -- | |
| Gibe 2P | $14,000 | -- | |
| Msw Prop 2P | -- | -- | |
| Msw Prop | $65,000 | -- | |
| Prince | $1,000 | -- | |
| Welch | $1,000 | -- |
Source: Public Records
Mortgage History
| Date | Status | Borrower | Loan Amount |
|---|---|---|---|
| Open | Cook David R | $188,030 |
Source: Public Records
Tax History Compared to Growth
Tax History
| Year | Tax Paid | Tax Assessment Tax Assessment Total Assessment is a certain percentage of the fair market value that is determined by local assessors to be the total taxable value of land and additions on the property. | Land | Improvement |
|---|---|---|---|---|
| 2025 | $2,986 | $80,899 | $5,842 | $75,057 |
| 2024 | $2,917 | $80,899 | $5,842 | $75,057 |
| 2023 | $2,778 | $56,110 | $3,300 | $52,810 |
| 2022 | $2,282 | $56,110 | $3,300 | $52,810 |
| 2021 | $2,154 | $56,110 | $3,300 | $52,810 |
| 2020 | $2,040 | $46,360 | $2,490 | $43,870 |
| 2019 | $2,040 | $46,360 | $2,490 | $43,870 |
| 2018 | $1,976 | $46,360 | $2,490 | $43,870 |
| 2017 | $2,225 | $46,360 | $2,490 | $43,870 |
| 2016 | $2,225 | $46,360 | $2,490 | $43,870 |
| 2015 | $2,019 | $38,760 | $2,540 | $36,220 |
| 2014 | $2,019 | $38,760 | $2,540 | $36,220 |
Source: Public Records
Map
Nearby Homes
- 21802 Meadow Wood Dr
- 17900 Crestwood Dr
- 22024 Brooks Rd
- 3408 S Lincoln St
- 3210 S Lincoln St
- 18596 Fisher Ford Rd
- 1413 E Emelyn Ln
- 21342 Highway 16 E
- 20888 Highway 16 E
- 21191 Keck Rd
- 0 Keck Rd
- 2786 S Olive Ct
- 2007 E Fennec St
- 1402 S Corsac St
- 605 Roselawn St
- 2503 Chanel St
- 2210 E Fennec St
- 2711 Summitt Dr
- 3251 E Kenwood St
- 21940 Sawmill Rd
- 17931 Fisher Ford Rd
- 17921 Fisher Ford Rd
- 17875 Fisher Ford Rd
- 17830 Fisher Ford Rd
- 17868 Ridgeway Dr
- 17809 Fisher Ford Rd Unit 177
- 17870 Ridgeway Dr
- 17900 Ridgeway Dr
- 17989 Fisher Ford Rd
- 17846 Ridgeway Dr
- 17834 Ridgeway Dr
- 17877 Ridgeway Dr
- 17942 Ridgeway Dr
- 17843 Ridgeway Dr
- 17949 Ridgeway Dr
- 17825 Ridgeway Dr
- 21898 Meadow Wood Dr
- 21968 Meadow Wood Dr
- 17952 Ridgeway Dr
- 17799 Ridgeway Dr