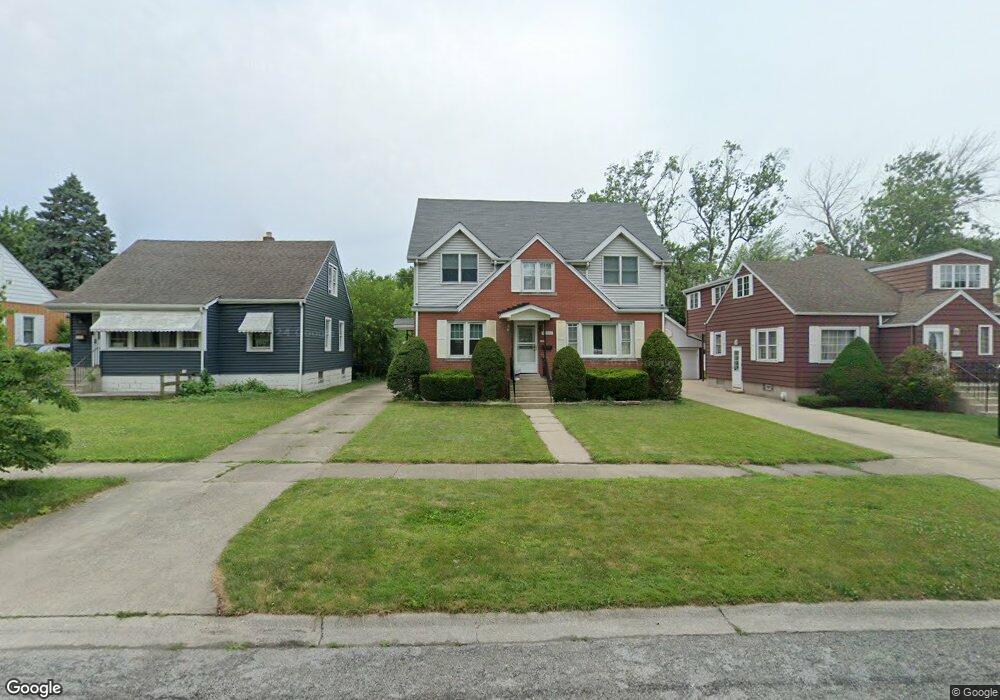
17934 Escanaba Ave Lansing, IL 60438
Estimated Value: $225,492 - $257,000
3
Beds
2
Baths
1,516
Sq Ft
$162/Sq Ft
Est. Value
About This Home
This home is located at 17934 Escanaba Ave, Lansing, IL 60438 and is currently estimated at $244,873, approximately $161 per square foot. 17934 Escanaba Ave is a home located in Cook County with nearby schools including Oak Glen Elementary School, Memorial Jr High School, and Thornton Fractnl So High School.
Ownership History
Date
Name
Owned For
Owner Type
Purchase Details
Closed on
May 23, 2009
Sold by
Legg Michael R and Legg Kari
Bought by
Legg Michael R and Legg Kari
Current Estimated Value
Purchase Details
Closed on
Jul 31, 2003
Sold by
Armstrong David C and Armstrong Denise M
Bought by
Legg Michael and Krolikowski Kari
Home Financials for this Owner
Home Financials are based on the most recent Mortgage that was taken out on this home.
Original Mortgage
$159,600
Outstanding Balance
$69,513
Interest Rate
5.47%
Mortgage Type
Unknown
Estimated Equity
$175,360
Purchase Details
Closed on
Sep 23, 1994
Sold by
Armstrong David C
Bought by
Armstrong David C and Armstrong Denise M
Home Financials for this Owner
Home Financials are based on the most recent Mortgage that was taken out on this home.
Original Mortgage
$68,000
Interest Rate
8.68%
Create a Home Valuation Report for This Property
The Home Valuation Report is an in-depth analysis detailing your home's value as well as a comparison with similar homes in the area
Home Values in the Area
Average Home Value in this Area
Purchase History
| Date | Buyer | Sale Price | Title Company |
|---|---|---|---|
| Legg Michael R | -- | None Available | |
| Legg Michael | $168,000 | Cti | |
| Armstrong David C | -- | -- |
Source: Public Records
Mortgage History
| Date | Status | Borrower | Loan Amount |
|---|---|---|---|
| Open | Legg Michael | $159,600 | |
| Previous Owner | Armstrong David C | $68,000 |
Source: Public Records
Tax History Compared to Growth
Tax History
| Year | Tax Paid | Tax Assessment Tax Assessment Total Assessment is a certain percentage of the fair market value that is determined by local assessors to be the total taxable value of land and additions on the property. | Land | Improvement |
|---|---|---|---|---|
| 2024 | $7,098 | $17,986 | $2,856 | $15,130 |
| 2023 | $3,912 | $19,000 | $2,856 | $16,144 |
| 2022 | $3,912 | $9,439 | $2,520 | $6,919 |
| 2021 | $3,862 | $9,439 | $2,520 | $6,919 |
| 2020 | $3,718 | $9,439 | $2,520 | $6,919 |
| 2019 | $5,428 | $12,964 | $2,352 | $10,612 |
| 2018 | $5,324 | $12,964 | $2,352 | $10,612 |
| 2017 | $5,410 | $12,964 | $2,352 | $10,612 |
| 2016 | $5,236 | $12,073 | $2,184 | $9,889 |
| 2015 | $4,801 | $12,073 | $2,184 | $9,889 |
| 2014 | $4,762 | $12,073 | $2,184 | $9,889 |
| 2013 | $4,493 | $12,608 | $2,184 | $10,424 |
Source: Public Records
Map
Nearby Homes
- 18010 Oakley Ave
- 18036 Oakley Ave
- 17825 Oakley Ave
- 18005 Arcadia Ave
- 18062 Exchange Ave
- 17803 Escanaba Ave
- 2745 179th St
- 18052 Commercial Ave
- 17819 Commercial Ave
- 17919 School St
- 2460 Indiana Ave
- 2616 Ridge Rd
- 2606 Ridge Rd
- 2715 Indiana Ave
- 17932 Oakwood Ave
- 2621 Ridge Rd
- 2643 Ridge Rd
- 18006 Oakwood Ave
- 2858 179th St
- 18101 Wildwood Ave
- 17940 Escanaba Ave
- 17930 Escanaba Ave
- 17946 Escanaba Ave
- 17924 Escanaba Ave
- 17941 Oakley Ave
- 17931 Oakley Ave
- 17950 Escanaba Ave
- 17920 Escanaba Ave
- 17945 Oakley Ave
- 17927 Oakley Ave
- 17914 Escanaba Ave
- 17954 Escanaba Ave
- 17951 Oakley Ave
- 17921 Oakley Ave
- 17929 Escanaba Ave
- 17935 Escanaba Ave
- 17925 Escanaba Ave
- 17941 Escanaba Ave
- 17921 Escanaba Ave
- 17945 Escanaba Ave