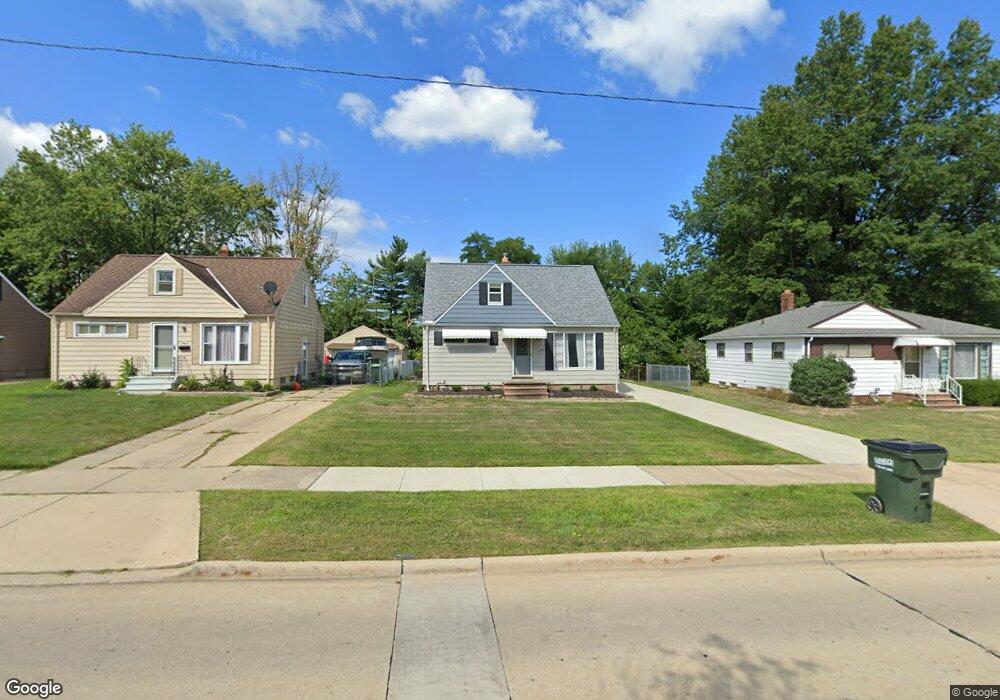
1794 Rush Rd Wickliffe, OH 44092
Estimated Value: $168,000 - $192,000
3
Beds
1
Bath
811
Sq Ft
$227/Sq Ft
Est. Value
About This Home
This home is located at 1794 Rush Rd, Wickliffe, OH 44092 and is currently estimated at $183,836, approximately $226 per square foot. 1794 Rush Rd is a home located in Lake County with nearby schools including Wickliffe Elementary School, Wickliffe Middle School, and Wickliffe High School.
Ownership History
Date
Name
Owned For
Owner Type
Purchase Details
Closed on
May 27, 2004
Sold by
Paduano Anthony F and Paduano Suzanne M
Bought by
Schwartfigure Thomas E and Schwartfigure Christine D
Current Estimated Value
Home Financials for this Owner
Home Financials are based on the most recent Mortgage that was taken out on this home.
Original Mortgage
$129,500
Outstanding Balance
$71,662
Interest Rate
8.5%
Mortgage Type
Purchase Money Mortgage
Estimated Equity
$112,174
Purchase Details
Closed on
Dec 16, 1998
Sold by
Beran Raymond J and Beran Irene
Bought by
Paduano Anthony F and Paduano Suzanne M
Home Financials for this Owner
Home Financials are based on the most recent Mortgage that was taken out on this home.
Original Mortgage
$92,025
Interest Rate
6.96%
Mortgage Type
FHA
Purchase Details
Closed on
Sep 5, 1990
Bought by
Beran Raymond J
Create a Home Valuation Report for This Property
The Home Valuation Report is an in-depth analysis detailing your home's value as well as a comparison with similar homes in the area
Home Values in the Area
Average Home Value in this Area
Purchase History
| Date | Buyer | Sale Price | Title Company |
|---|---|---|---|
| Schwartfigure Thomas E | $129,500 | Tower City Title Agency Llc | |
| Paduano Anthony F | $98,125 | Executive Title Agency Corp | |
| Beran Raymond J | -- | -- |
Source: Public Records
Mortgage History
| Date | Status | Borrower | Loan Amount |
|---|---|---|---|
| Open | Schwartfigure Thomas E | $129,500 | |
| Closed | Paduano Anthony F | $92,025 |
Source: Public Records
Tax History
| Year | Tax Paid | Tax Assessment Tax Assessment Total Assessment is a certain percentage of the fair market value that is determined by local assessors to be the total taxable value of land and additions on the property. | Land | Improvement |
|---|---|---|---|---|
| 2025 | -- | $55,460 | $17,770 | $37,690 |
| 2024 | -- | $55,460 | $17,770 | $37,690 |
| 2023 | $5,390 | $43,830 | $15,360 | $28,470 |
| 2022 | $3,536 | $43,830 | $15,360 | $28,470 |
| 2021 | $3,156 | $43,830 | $15,360 | $28,470 |
| 2020 | $2,972 | $35,060 | $12,290 | $22,770 |
| 2019 | $2,971 | $35,060 | $12,290 | $22,770 |
| 2018 | $2,566 | $35,590 | $13,610 | $21,980 |
| 2017 | $2,506 | $35,590 | $13,610 | $21,980 |
| 2016 | $2,785 | $35,590 | $13,610 | $21,980 |
| 2015 | $2,450 | $35,590 | $13,610 | $21,980 |
| 2014 | $2,158 | $35,590 | $13,610 | $21,980 |
| 2013 | $2,157 | $35,590 | $13,610 | $21,980 |
Source: Public Records
Map
Nearby Homes
- 1842 Eldon Dr
- 30350 Twin Lakes Dr
- 30530 Grant St
- 30302 Overlook Dr
- 1597 Lee Terrace Dr Unit F11
- 1677 Mapledale Rd
- 1719 E 300th St
- 30529 Ridge Rd
- 1648 Douglas Rd
- 5642 Grand Place
- 30335 Euclid Ave Unit 40 and 20
- 5481 Millwood Ln Unit C
- V/L E 298th St
- 1522 Mapledale Rd
- 5512 Sutton Ln Unit D
- 1540 E 298th St
- 1526 E 298th St
- 1824 Robindale St
- 34345 Giovanni Ave
- 2265 Country Club Dr
Your Personal Tour Guide
Ask me questions while you tour the home.