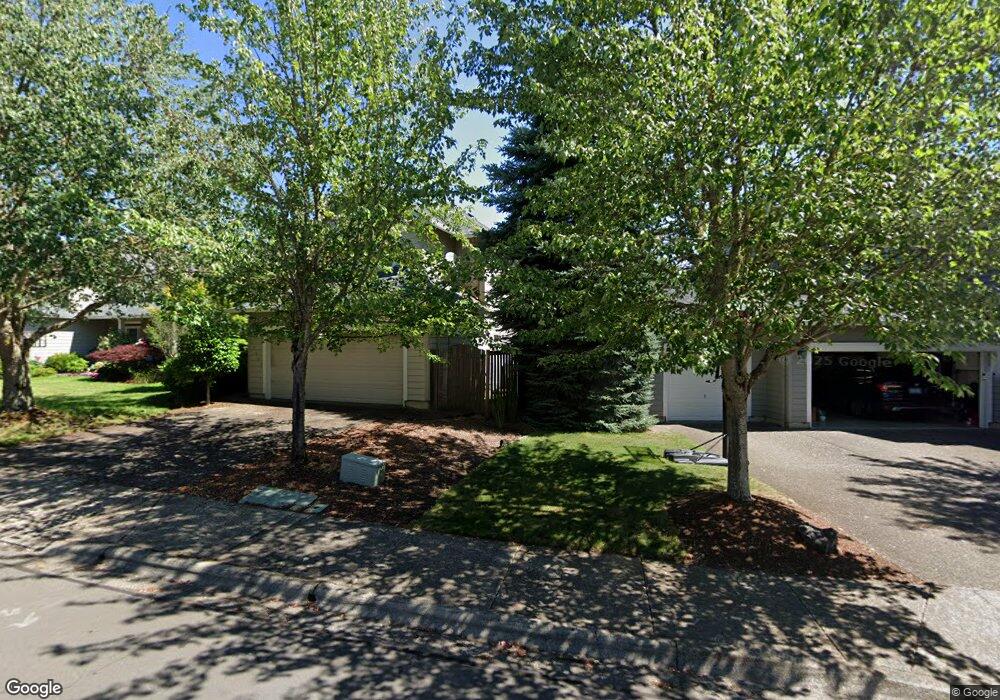
17943 SW Mandel Ln Sherwood, OR 97140
Estimated Value: $602,000 - $660,000
3
Beds
3
Baths
1,759
Sq Ft
$356/Sq Ft
Est. Value
About This Home
This home is located at 17943 SW Mandel Ln, Sherwood, OR 97140 and is currently estimated at $626,757, approximately $356 per square foot. 17943 SW Mandel Ln is a home located in Washington County with nearby schools including Middleton Elementary School, Sherwood Middle School, and Sherwood High School.
Ownership History
Date
Name
Owned For
Owner Type
Purchase Details
Closed on
Jul 30, 2004
Sold by
Eastman Casey M
Bought by
Diers Stephen W and Diers Bernadine M
Current Estimated Value
Home Financials for this Owner
Home Financials are based on the most recent Mortgage that was taken out on this home.
Original Mortgage
$190,400
Outstanding Balance
$96,229
Interest Rate
6.29%
Mortgage Type
Unknown
Estimated Equity
$530,528
Purchase Details
Closed on
Mar 27, 2001
Sold by
Hodge Trevor L and Hodge Diana K
Bought by
Eastman Casey W
Home Financials for this Owner
Home Financials are based on the most recent Mortgage that was taken out on this home.
Original Mortgage
$184,500
Interest Rate
4.95%
Purchase Details
Closed on
Jan 16, 1997
Sold by
Tamarack Developments Corp
Bought by
Hodge Trevor L and Hodge Diana K
Home Financials for this Owner
Home Financials are based on the most recent Mortgage that was taken out on this home.
Original Mortgage
$166,535
Interest Rate
7.62%
Mortgage Type
VA
Purchase Details
Closed on
Sep 5, 1996
Sold by
Quinkster General Partnership
Bought by
Tamarack Developments Corp
Create a Home Valuation Report for This Property
The Home Valuation Report is an in-depth analysis detailing your home's value as well as a comparison with similar homes in the area
Home Values in the Area
Average Home Value in this Area
Purchase History
| Date | Buyer | Sale Price | Title Company |
|---|---|---|---|
| Diers Stephen W | $238,000 | Transnation Title | |
| Eastman Casey W | $205,000 | First American | |
| Hodge Trevor L | $163,270 | First American Title Ins Co | |
| Tamarack Developments Corp | $42,000 | Oregon Title Insurance Co |
Source: Public Records
Mortgage History
| Date | Status | Borrower | Loan Amount |
|---|---|---|---|
| Open | Diers Stephen W | $190,400 | |
| Previous Owner | Eastman Casey W | $184,500 | |
| Previous Owner | Hodge Trevor L | $166,535 |
Source: Public Records
Tax History Compared to Growth
Tax History
| Year | Tax Paid | Tax Assessment Tax Assessment Total Assessment is a certain percentage of the fair market value that is determined by local assessors to be the total taxable value of land and additions on the property. | Land | Improvement |
|---|---|---|---|---|
| 2025 | $6,058 | $317,800 | -- | -- |
| 2024 | $5,913 | $308,550 | -- | -- |
| 2023 | $5,913 | $299,570 | $0 | $0 |
| 2022 | $5,290 | $299,570 | $0 | $0 |
| 2021 | $5,221 | $282,380 | $0 | $0 |
| 2020 | $5,135 | $274,160 | $0 | $0 |
| 2019 | $5,037 | $266,180 | $0 | $0 |
| 2018 | $4,885 | $258,430 | $0 | $0 |
| 2017 | $4,757 | $250,910 | $0 | $0 |
| 2016 | $4,606 | $243,610 | $0 | $0 |
| 2015 | $4,376 | $236,520 | $0 | $0 |
| 2014 | $4,328 | $229,640 | $0 | $0 |
Source: Public Records
Map
Nearby Homes
- 22864 SW Forest Creek Dr Unit 200
- 22836 SW Forest Creek Dr Unit 201
- 22860 SW Forest Creek Dr Unit 203
- 22802 SW Forest Creek Dr
- 22802 SW Forest Creek Dr Unit 101
- 22370 SW Pacific Hwy
- 22491 SW Dewey Dr
- 18318 SW Woodhaven Dr
- 17665 SW Elder View Dr
- 22770 SW Elwert Rd
- 17361 SW Inkster Dr
- 23662 SW Pinehurst Dr
- 17337 SW Galewood Dr
- 22184 SW Fisk Terrace
- 22767 SW Saunders Dr
- 22086 SW Hines Place
- 18533 SW Colfelt Ln
- 23798 SW Heron Lakes Dr
- 17241 SW Meinecke Rd
- 17458 SW Inkster Dr
- 17965 SW Mandel Ln
- 17907 SW Mandel Ln
- 17822 SW Ballard Ln
- 17981 SW Mandel Ln
- 17840 SW Ballard Ln
- 17879 SW Mandel Ln
- 17800 SW Ballard Ln
- 17954 SW Mandel Ln
- 17932 SW Mandel Ln
- 17858 SW Ballard Ln
- 17976 SW Mandel Ln
- 17914 SW Mandel Ln
- 17855 SW Mandel Ln
- 17976 SW Woodhaven Dr
- 17784 SW Ballard Ln
- 17892 SW Mandel Ln
- 17990 SW Mandel Ln
- 17950 SW Woodhaven Dr
- 17874 SW Ballard Ln
- 17870 SW Mandel Ln