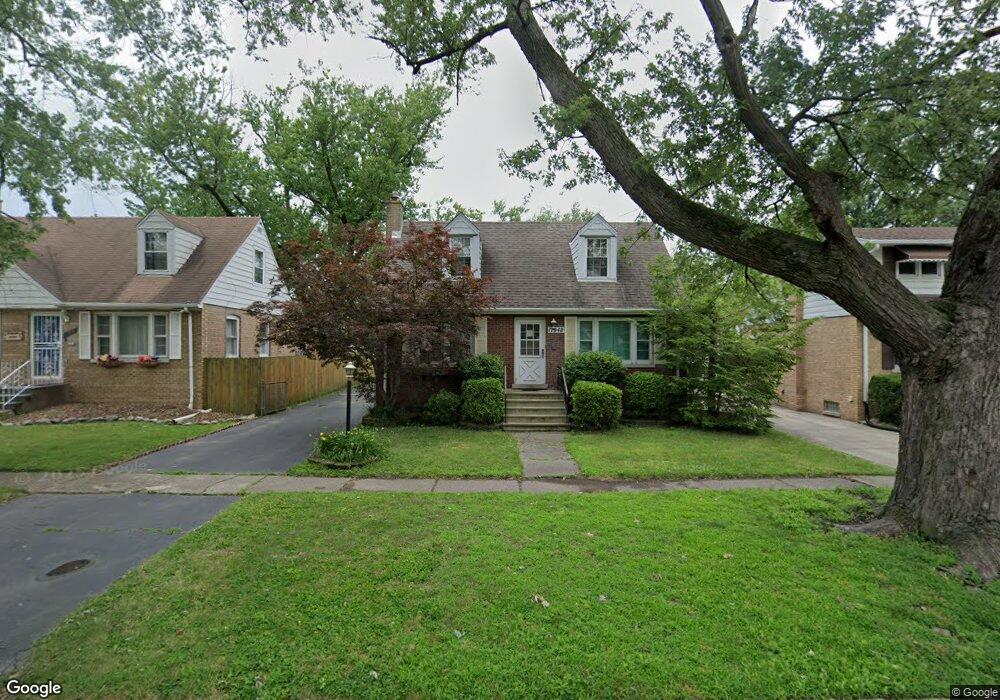
17948 Exchange Ave Lansing, IL 60438
Estimated Value: $204,886 - $247,000
3
Beds
1
Bath
1,301
Sq Ft
$169/Sq Ft
Est. Value
About This Home
This home is located at 17948 Exchange Ave, Lansing, IL 60438 and is currently estimated at $219,472, approximately $168 per square foot. 17948 Exchange Ave is a home located in Cook County with nearby schools including Oak Glen Elementary School, Memorial Jr High School, and Thornton Fractnl So High School.
Ownership History
Date
Name
Owned For
Owner Type
Purchase Details
Closed on
Nov 14, 2003
Sold by
Bogs Reilly Jeanette
Bought by
Hudson Julie
Current Estimated Value
Home Financials for this Owner
Home Financials are based on the most recent Mortgage that was taken out on this home.
Original Mortgage
$124,033
Outstanding Balance
$57,542
Interest Rate
6.01%
Mortgage Type
FHA
Estimated Equity
$161,930
Purchase Details
Closed on
Sep 28, 1999
Sold by
Frye Del E and Frye Carolyn A
Bought by
Bogs Jeanette Y
Home Financials for this Owner
Home Financials are based on the most recent Mortgage that was taken out on this home.
Original Mortgage
$40,000
Interest Rate
7.87%
Purchase Details
Closed on
Aug 4, 1997
Sold by
Johnson Raymond W and Johnson Linda I
Bought by
Frye Del E and Frye Carolyn A
Home Financials for this Owner
Home Financials are based on the most recent Mortgage that was taken out on this home.
Original Mortgage
$97,137
Interest Rate
7.71%
Mortgage Type
FHA
Create a Home Valuation Report for This Property
The Home Valuation Report is an in-depth analysis detailing your home's value as well as a comparison with similar homes in the area
Home Values in the Area
Average Home Value in this Area
Purchase History
| Date | Buyer | Sale Price | Title Company |
|---|---|---|---|
| Hudson Julie | $126,000 | Multiple | |
| Bogs Jeanette Y | $111,000 | Professional National Title | |
| Frye Del E | $69,000 | -- |
Source: Public Records
Mortgage History
| Date | Status | Borrower | Loan Amount |
|---|---|---|---|
| Open | Hudson Julie | $124,033 | |
| Previous Owner | Bogs Jeanette Y | $40,000 | |
| Previous Owner | Frye Del E | $97,137 |
Source: Public Records
Tax History Compared to Growth
Tax History
| Year | Tax Paid | Tax Assessment Tax Assessment Total Assessment is a certain percentage of the fair market value that is determined by local assessors to be the total taxable value of land and additions on the property. | Land | Improvement |
|---|---|---|---|---|
| 2024 | $5,024 | $13,701 | $2,678 | $11,023 |
| 2023 | $4,008 | $13,701 | $2,678 | $11,023 |
| 2022 | $4,008 | $9,588 | $2,363 | $7,225 |
| 2021 | $3,955 | $9,587 | $2,362 | $7,225 |
| 2020 | $3,805 | $9,587 | $2,362 | $7,225 |
| 2019 | $3,565 | $9,692 | $2,205 | $7,487 |
| 2018 | $3,496 | $9,692 | $2,205 | $7,487 |
| 2017 | $3,564 | $9,692 | $2,205 | $7,487 |
| 2016 | $3,135 | $8,230 | $2,047 | $6,183 |
| 2015 | $2,849 | $8,230 | $2,047 | $6,183 |
| 2014 | $1,917 | $8,230 | $2,047 | $6,183 |
| 2013 | $3,100 | $9,515 | $2,047 | $7,468 |
Source: Public Records
Map
Nearby Homes
- 18010 Oakley Ave
- 2745 179th St
- 18036 Oakley Ave
- 17825 Oakley Ave
- 18062 Exchange Ave
- 18052 Commercial Ave
- 17803 Escanaba Ave
- 17919 School St
- 17819 Commercial Ave
- 18005 Arcadia Ave
- 2715 Indiana Ave
- 2460 Indiana Ave
- 17932 Oakwood Ave
- 2616 Ridge Rd
- 2606 Ridge Rd
- 18006 Oakwood Ave
- 2858 179th St
- 18101 Wildwood Ave
- 17913 Oakwood Ave
- 2643 Ridge Rd
- 17954 Exchange Ave
- 17944 Exchange Ave
- 17958 Exchange Ave
- 17938 Exchange Ave
- 17945 Escanaba Ave
- 17949 Escanaba Ave
- 17932 Exchange Ave
- 17941 Escanaba Ave
- 17955 Escanaba Ave
- 17935 Escanaba Ave
- 17947 Exchange Ave
- 17953 Exchange Ave
- 17943 Exchange Ave
- 17928 Exchange Ave
- 17957 Exchange Ave
- 17929 Escanaba Ave
- 17931 Exchange Ave
- 17922 Exchange Ave
- 18001 Escanaba Ave
- 17925 Escanaba Ave