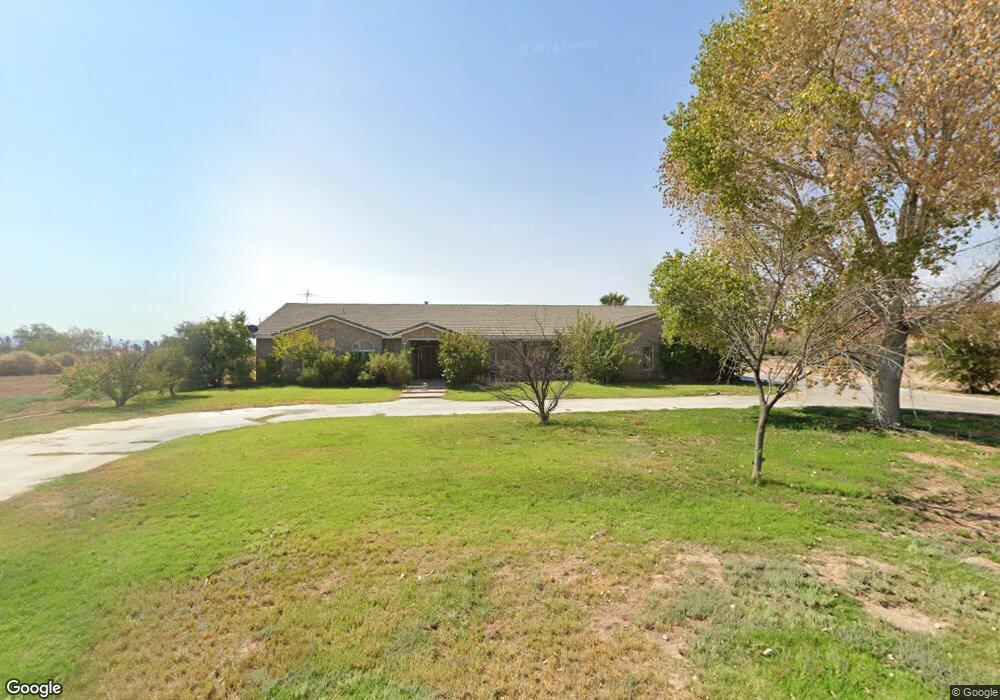
1795 Cappalappa Ave Logandale, NV 89021
Estimated Value: $698,000 - $755,199
4
Beds
3
Baths
3,670
Sq Ft
$200/Sq Ft
Est. Value
About This Home
This home is located at 1795 Cappalappa Ave, Logandale, NV 89021 and is currently estimated at $734,050, approximately $200 per square foot. 1795 Cappalappa Ave is a home with nearby schools including Grant Bowler Elementary School, Mack Lyon Middle School, and Moapa Valley High School.
Ownership History
Date
Name
Owned For
Owner Type
Purchase Details
Closed on
Nov 15, 2004
Sold by
Wells Linda Ann
Bought by
Wells Stan P
Current Estimated Value
Home Financials for this Owner
Home Financials are based on the most recent Mortgage that was taken out on this home.
Original Mortgage
$285,000
Outstanding Balance
$141,335
Interest Rate
5.79%
Mortgage Type
New Conventional
Estimated Equity
$592,715
Purchase Details
Closed on
Jan 15, 2002
Sold by
Wells Linda A
Bought by
Wells Stan P
Home Financials for this Owner
Home Financials are based on the most recent Mortgage that was taken out on this home.
Original Mortgage
$260,286
Interest Rate
6.84%
Purchase Details
Closed on
Aug 15, 2000
Sold by
Wells Stan P
Bought by
Wells Stan P and Wells Linda A
Home Financials for this Owner
Home Financials are based on the most recent Mortgage that was taken out on this home.
Original Mortgage
$60,000
Interest Rate
8.15%
Mortgage Type
Credit Line Revolving
Create a Home Valuation Report for This Property
The Home Valuation Report is an in-depth analysis detailing your home's value as well as a comparison with similar homes in the area
Home Values in the Area
Average Home Value in this Area
Purchase History
| Date | Buyer | Sale Price | Title Company |
|---|---|---|---|
| Wells Stan P | -- | Land Title Of Nevada | |
| Wells Stan P | -- | Stewart Title | |
| Wells Stan P | -- | United Title |
Source: Public Records
Mortgage History
| Date | Status | Borrower | Loan Amount |
|---|---|---|---|
| Open | Wells Stan P | $285,000 | |
| Previous Owner | Wells Stan P | $260,286 | |
| Previous Owner | Wells Stan P | $60,000 |
Source: Public Records
Tax History Compared to Growth
Tax History
| Year | Tax Paid | Tax Assessment Tax Assessment Total Assessment is a certain percentage of the fair market value that is determined by local assessors to be the total taxable value of land and additions on the property. | Land | Improvement |
|---|---|---|---|---|
| 2025 | $3,389 | $208,094 | $23,625 | $184,469 |
| 2024 | $3,291 | $208,094 | $23,625 | $184,469 |
| 2023 | $3,291 | $193,725 | $19,530 | $174,195 |
| 2022 | $3,196 | $176,545 | $17,325 | $159,220 |
| 2021 | $3,103 | $169,530 | $16,538 | $152,992 |
| 2020 | $2,990 | $168,738 | $16,538 | $152,200 |
| 2019 | $2,903 | $150,852 | $15,750 | $135,102 |
| 2018 | $2,818 | $146,222 | $15,750 | $130,472 |
| 2017 | $3,770 | $149,198 | $15,750 | $133,448 |
| 2016 | $2,691 | $125,610 | $14,175 | $111,435 |
| 2015 | $2,687 | $102,261 | $14,175 | $88,086 |
| 2014 | $2,608 | $109,400 | $14,175 | $95,225 |
Source: Public Records
Map
Nearby Homes
- 2925 Rice St
- 1917 N Moapa Valley Blvd
- 2770 Taylor St
- 1990 Liston Ave
- 1 N Heyer St
- 0 N Heyer St
- 985 Hinckley Ave
- 1625 Metcalf Dr
- 1141 Thomas Bay Cir
- 0 Moapa Valley
- 921 Gubler Ave
- 1635 Zubia St
- 0 N Yamashita St
- 1140 Mahoney Ave
- 0 0 Ash and Diane Unit 2681485
- 2030 Ash St
- 1470 St Joseph St
- 0 W Cram Ave
- 0 Unit 2676698
- 0 Diane Ave
- 1745 Cappalappa Ave
- 1825 Cappalappa Ave
- 1820 Cappalappa Ave
- 1720 Cappalappa Ave
- 1695 Cappalappa Ave
- 1698 Cappalappa Ave
- 1795 Wittwer Ave
- 2320 Paiute St
- 2320 Paiute St
- 1694 Anasazi Ave
- 1870 Cappalappa Ave
- 1685 Cappalappa Ave
- 1875 Cappalappa Ave
- 1680 Cappalappa Ave
- 1665 Cappalappa Ave
- 1689 Anasazi Ave
- 1662 Cappalappa Ave
- 2385 Robison Farm Rd
- 1669 Anasazi Ave
- 1650 Anasazi Ave